Bitcoin chart analysis: How will the market develop in the future?
Bitcoin continues to strongly break through key resistance, standing at a historic high of $116,000. This breakout trend is injecting new momentum into the market, and the focus of traders is on how high it will surge next. This article will analyze it from a technical chart perspective.
Macroeconomic Background
As the S&P 500 and the Nasdaq Composite Index closed at historical highs for the third time in four trading days, and gold futures reached $3,370 per ounce, risk assets are receiving broad buying support as the Federal Reserve maintains its patient stance on monetary policy.
The upward momentum of Bitcoin is also resonating with the explosive U.S. employment data — 147,000 non-farm jobs were added in June (expected 110,000). Although the strong employment data initially caused Bitcoin to drop below $109,000 due to rate hike concerns, the market quickly absorbed the selling pressure and pushed it to a local new high.
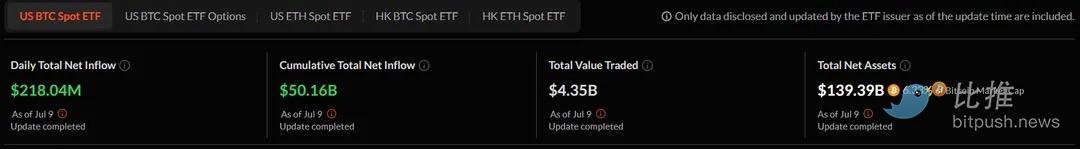
Institutional adoption remains the core driving force. In July, the cumulative inflow of Bitcoin ETFs has surpassed the 50 billion dollar mark. This continuous institutional buying provides crucial support for any pullbacks and validates Bitcoin’s evolution from a speculative asset to a portfolio allocation asset.
The synergy between technological breakthroughs and institutional accumulation has led traders to speculate: after overcoming the final barrier to the unknown, where will Bitcoin go from here?
Bitcoin Chart: Double Breakthrough Aiming at Last Resistance
Bitcoin recently surged to $113,000, marking the onset of a new historical high region, which is also a decisive technical breakthrough against the two major patterns that had suppressed prices for several weeks.
The 4-hour chart shows that Bitcoin has cleanly broken through a symmetrical triangle formation, while the daily chart shows smaller fluctuations, with bullish momentum appearing slightly lacking. This is to be expected in this type of pattern, but such a long candlestick leaves little doubt. The breakout confirmation is clear enough to turn almost all key indicators bullish within the intraday timeframe.
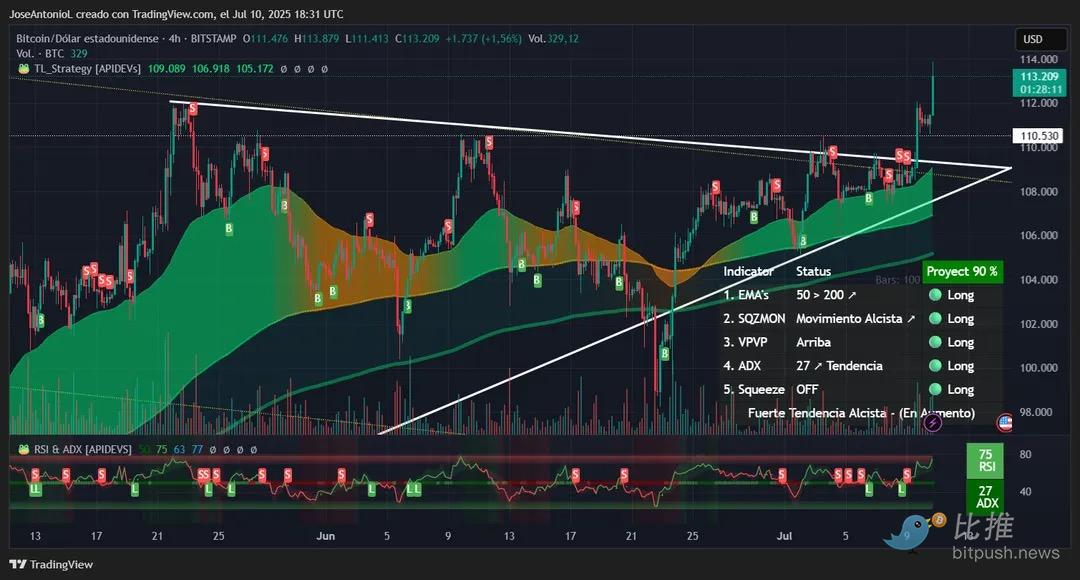
Source of the image TradingView
On the 4-hour chart, the Average Directional Index (ADX) is at 27. This typically confirms a trending market. The ADX measures trend strength without considering direction, and when it breaks above 25, it signals to momentum traders that a sustainable trend is forming, which often triggers systematic buying from trend-following strategies.
However, the Relative Strength Index (RSI) reaching 75 indicates that Bitcoin has entered the overbought zone. One might consider the RSI as a market thermometer—when the reading is too high, it often signals a cooling demand. The current situation may suggest that an adjustment is imminent after a significant rise. However, it is important to note that Bitcoin has maintained bullish momentum at higher RSI levels multiple times.
The daily chart’s squeeze momentum indicator shows a “close” status, indicating that the recent volatility released from the compressed market aligns with previous analytical expectations. This suggests that the initial breakout has been realized, and traders should prepare for a continuation of the upward trend or consolidation at the current level.
Overall, the price is signaling bullish momentum. Although the probability of an upward trend continuation is high, given that the pullback candlesticks generally show slight fluctuations, the adjustments are not expected to pose a threat to the trend.
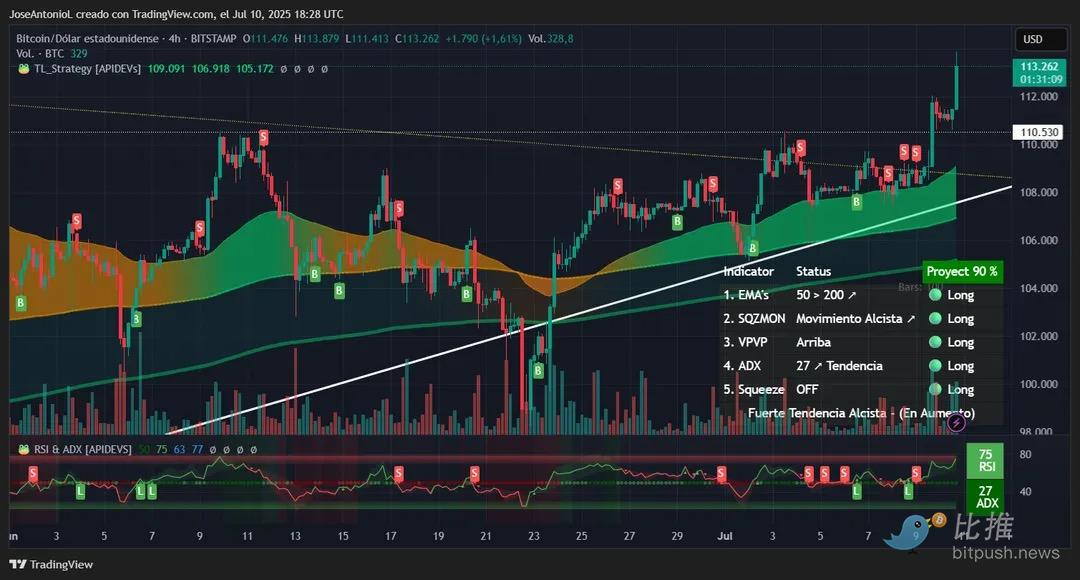
The daily chart also shows a bullish structure: Bitcoin has broken free from the descending bearish channel that has suppressed prices since the May high (marked by the yellow line in the above chart). It currently seems to be forming a bullish support line (marked by the white line in the above chart), referencing the April pullback low and the June low. If confirmed effectively, Bitcoin may oscillate near this support line, maintaining bullish momentum and making 110,000 dollars a new support by the end of the month.
The RSI on the daily chart reports 67, indicating healthy momentum and has not reached the overbought area above 70—suggesting further upside potential. This reading informs traders that buying pressure remains strong, but has not yet reached the extreme levels that typically signal a correction.
The daily ADX report of 12 indicates that the trend is still developing and has not yet reached a level that can be defined as a clear pattern—the short-term charts often contain a lot of noise. Although it is below the key threshold of 25 for confirming a strong directional movement, low readings after a breakout often signal calm before acceleration. Traders interpret this as an accumulation phase before the next wave of impulsive upward movement.
The moving average analysis shows that Bitcoin is steadily above the 50-period and 200-period Exponential Moving Averages (EMA) across multiple time frames. The widening gap between these moving averages (known as moving average divergence) typically indicates a strong trend state and acts as dynamic support during pullbacks.
Key price level
- Immediate support: $110,197 (breakthrough retest level)
- Strong support range: $105,000 - $108,700 (support line)
- Expected resistance: $115,000 (based on triangle breakout measured target and Fibonacci extension level)
Bitcoin Market Outlook
The synergy of technological breakthroughs, institutional capital flow, and a favorable macro environment is likely to drive Bitcoin to continue its bullish trend after breaking through historical resistance. However, traders who prefer technical analysis should monitor whether the daily ADX can break through 25 to confirm trend strength, while also being alert to the RSI bearish divergence phenomenon when new highs fail.
Looking at a broader perspective, Bitcoin may still experience significant fluctuations in July: The Trump administration’s “Great Beautiful Plan” and other policies may lead to a $3.3 trillion increase in the U.S. deficit—historically, this has been favorable for scarce assets like BTC. In addition, the deadline for the White House’s cryptocurrency executive order report on July 22 is approaching, which may involve updates to the U.S. strategic Bitcoin reserves and could become a potential catalyst.
Statement:
- This article is reprinted from [TechFlow] The copyright belongs to the original author [Jose Antonio Lanz, Guillermo Jimenez], if there are objections to the reprint, please contact Gate Learn TeamThe team will process it as soon as possible according to the relevant procedures.
- Disclaimer: The views and opinions expressed in this article are those of the author and do not constitute any investment advice.
- Other language versions of the article are translated by the Gate Learn team, unless otherwise mentioned.GateUnder such circumstances, it is prohibited to copy, disseminate, or plagiarize translated articles.
Related articles

In-depth Explanation of Yala: Building a Modular DeFi Yield Aggregator with $YU Stablecoin as a Medium

BTC and Projects in The BRC-20 Ecosystem

What Is a Cold Wallet?

What is the Altcoin Season Index?

How to Stake ETH?
