What Is The Ichimoku Cloud?
In the 1930s, the Ichimoku Cloud was invented by Japanese journalist Hosoda Takeichi under the pseudonym of Ichimoku Sanjin. In Ichimoku Clouds, it is necessary to set three cycles: short (one and a half weeks), medium (one month) and long (two months). At that time, the working hours in Japan were 6 days a week, so the traditional setting was (9, 26, 52). However, since the working hours in modern society is five days a week, some people revised the setting to (7, 22, 44).

How does the Ichimoku Cloud work
Ichimoku Clouds consist of five lines. These lines are calculated by averaging the highest and lowest prices in a given period, which is slightly different from the commonly used Moving Average. The calculation can be changed according to the cycle set. We’ll give a description in the traditional (9, 26, 52) set below.
Conversion line: the average of the highest and lowest prices in the past 9 days, which is used to analyze short-term trends.
Baseline: the average of the highest and lowest prices in the past 26 days, which is used to analyze medium-term trends.
Lagging span: the line that shifts the current price to the left by 26 days.
Leading span A: the average value of the conversion line and the baseline, which is used to predict the trend in the next 26 days.
Leading span B: the average value of the highest and lowest prices in the past 52 days, and the line that predicts the trend in the next 26 days.
Since both leading span A and leading span B predict the market trend in the next 26 days, it is helpful to analyze future prices. The space between the leading span A and the leading span B forms a Kumo Cloud.
Ichimoku Clouds analysis
Since Ichimoku Clouds are composed of five lines, and the trading signal also depends on many factors, we can interpret it from three aspects:
1. Relationship between conversion line, baseline and market price
When the price goes above the baseline, and the conversion line is above the baseline, here is a signal of upward trend. If it is under the baseline, and the conversion line is below the baseline, here is a sign of downward trend.
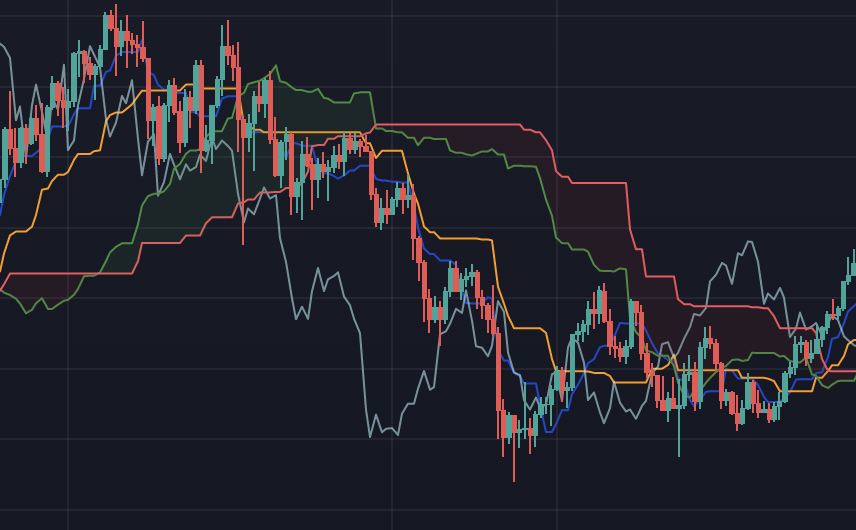
As shown in the chart below, the gold crossing of the conversion line (blue line) above the baseline (orange line) represents a strong upward momentum of the market.

2. Understanding Kumo Cloud
Kumo Cloud is a signal to predict market trends. Both leading span A and leading span B are indicators for predicting the future support and resistance.
When the price is above Kumo Cloud, the Kumo Cloud appears in green, indicating that the bulls have an advantage and the cloud can be used as a support;

When the price is below Kumo Cloud, it indicates that the bears have an advantage and the cloud can be used as a resistance;
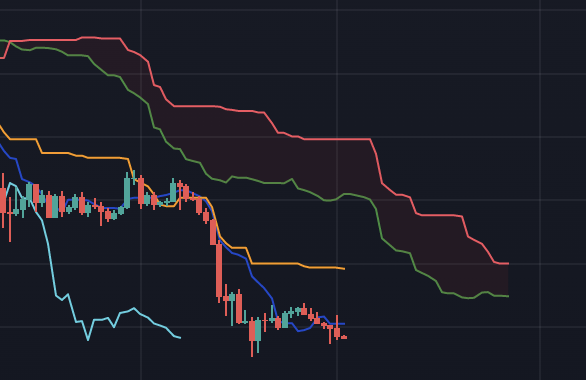
In the upward trend, when the Kumo Cloud becomes thinner and the leading span A and leading span B begin to cross, it means that the market has reached the high point and will no longer continue to rise. If the leading span A falls below the leading span B, it means that the Kumo Cloud area turns around and changes color, indicating that the price trend may be about to reverse.
3. Understanding lagging span
The lagging span is also an important indicator, which reflects the current price compared with the price 26 days ago. If the market price is higher than the lagging band, it predicts a bullish trend; otherwise, if it is lower than the market price, it predicts a bearish trend.
Lagging span is usually used together with other indicators of Ichimoku Clouds, never alone.

Ichimoku Clouds in crypto market
The initial configuration of Ichimoku Clouds is based on the working hours of six days a week in Japan in the past. In order, the short (one week and a half), medium (one month) and long (two months) time configurations are (9, 26, 52). But now, in modern society, people mostly work five days a week, so some of them proposed that the time allocation should be changed to (7, 22, 44) or (8, 22, 44).
As the crypto space is 7/24 non-stop transactions, some crypto investors questioned whether it should be adjusted to (10, 30, 60) which is more suitable for the crypto market. However, it was also suggested that such arbitrary changes would make Ichimoku Clouds useless.
Limitations of Ichimoku Clouds
Although Ichimoku Clouds can judge the market trend, indicating strong support and resistance, and judge the timing of entry and exit, it is more suitable for a downward or upward market. When the direction of the market is not clear, the cloud is impossible to give useful trading signals.
In addition, although Ichimoku Clouds use the leading spans to predict the future market, there is no predictability in the formula. Both of them use the past price to estimate the future trend. Although sometimes it can predict the future trend, there is no guarantee that what has happened will happen again.
Conclusion
The Ichimoku Cloud is a technical analysis tool composed of several indicators, so it’s pretty difficult to understand. Because its types are composed of fixed formulas, compared with other technical tools that rely on subjective judgment (such as drawing trend lines, judging patterns, etc.), the Ichimoku Cloud greatly simplifies the labor demand during trading.
Like other technical indicators, Ichimoku Clouds should be used together with other indicators to reduce risks. If you have any questions about technical analysis, you can refer to "What Is Technical Analysis" or go to Gate Learn to find any knowledge you need.
Related Articles

Exploring 8 Major DEX Aggregators: Engines Driving Efficiency and Liquidity in the Crypto Market

What Is Copy Trading And How To Use It?

How to Do Your Own Research (DYOR)?

What Is Technical Analysis?

What Is Fundamental Analysis?
