Focus on indicator strategy research, with images to provide evidence, for a more intuitive judgment of market trends. Allow newbies to quickly get started and be able to trade independently.
1
Following
767
Followers
70
Like
Pin
Mir.Z
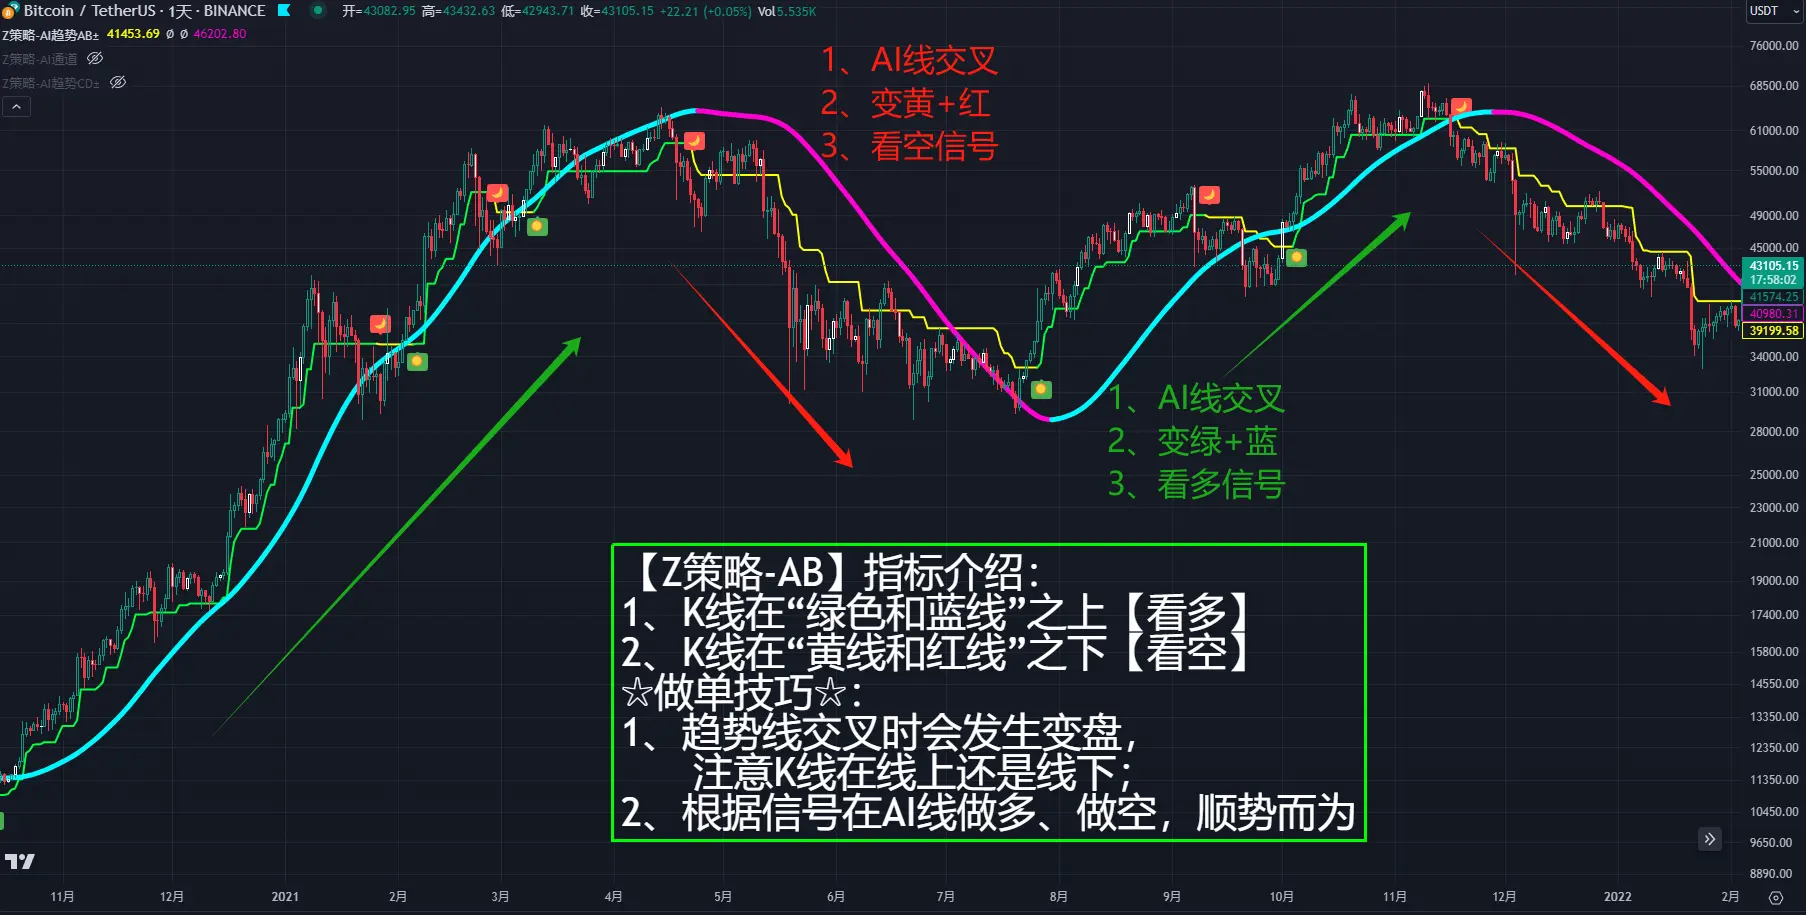
【Z Strategy】Graphic and text introduction of AI indicators
View Original
17 Likes
Reward
17
4
Share
GoodLuckComesWithHig:
👍
View More
Mir.Z
Light Position shorting AERGO Set the stop loss at the previous high Entertainment position, do not take a heavy position. Prevent the rate from draining your blood
BTC trend prediction, what kind of script do you think it is on the chart?! 1. Breakthrough channel and rise above the yellow line 2. Fluctuating downward within the channel Welcome to comment!
SUI Indicator Signal: Yellow Line Below Red Line 'Bearish Trend' There are two types of recommendations for spot ordering: 1. Buy in batches at the lower support, and the low point cannot be determined (It is riskier to open a position on the left side and is easy to be trapped) 2. Wait for the price to break through the trend line, turn from yellow to green, and enter the market with the trend (The security of opening a position on the right side is good, and the probability of buying is high)
1. ONDO indicator signal: red + yellow = bearish trend 2. At present, the triangle pattern has broken down 3. And reverse the lower edge of the triangle 4. There is a high probability that it will continue to decline 5. The purchase reference is entered in batches in the green box below 6. Or wait for the price to stand on the trend line The yellow line becomes a green line, which is highly secure
ENA is currently one of the stronger coins in the copycat It did not continue to make new lows, and the rebound was okay There are two types of buying strategies: 1. Break through 0.48 and step in 2. Buy in batches within the green box below
1. Yesterday Rebounded the high point of the 4th wave, now it is going down the 5th wave, will it break below 8 and accelerate to the 7s? I will further observe 2. Those seeking stability should not rush to enter the market
1、ETH reference to the white downtrend script 2, [Z Strategy] Indicator Signal: Period: Daily Yellow+Red Bearish Trend ( Drawing is a high-probability prediction of market trends, aimed at clarifying ideas and formulating trading strategies in advance)
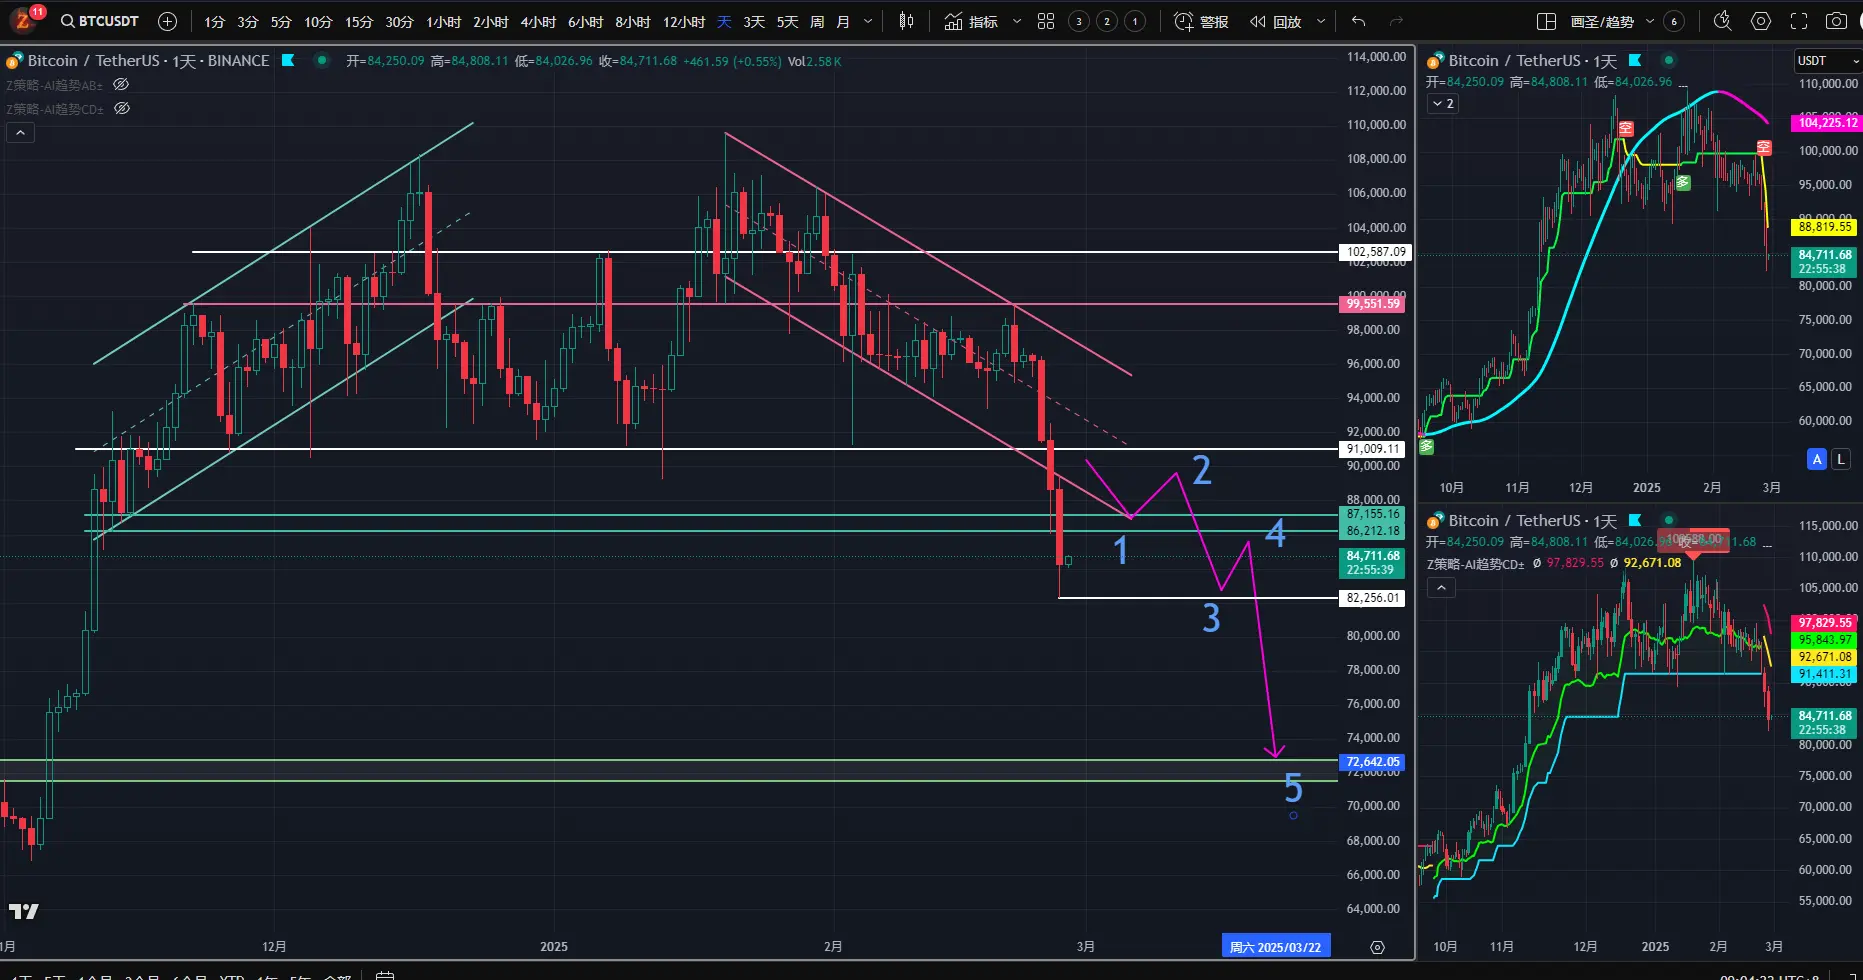
1. BTC is currently in a 3-wave decline. Will there be a 5th wave? We shall see. 2, [Z Strategy] indicator signal: Period: Daily Yellow + Red Bearish Trend ( Drawing is a high probability of predicting the market, the purpose is to clarify ideas, and formulate trading strategies in advance)
【Daily Analysis】AI Sector - TAO 1. Trend plot: To better understand, let's talk with the help of the chart. 2. [Z Strategy] Indicator signal: Period: 4 hours Yellow+Red Bearish Trend (Drawing is a rough prediction of the market, the purpose is to clarify the thinking, and to formulate trading strategies in advance) $TAO
1. Only when BTC and ETH break through the red resistance zone, there is a chance for further rebound. If they fall below the green support area, the possibility of breaking the 9-starting is increased; 2. Once BTC breaks the 9-starting, the weekly MACD will form a death cross trend, which may trigger panic selling; 3. ETH shows a bearish engulfing pattern on the weekly K-line, indicating relative weakness.
【Daily Analysis】AI Sector - ARKM 1. The price has reached the support level in the white zone: Hold on for a rebound and adjust downward if it breaks 2, [Z Strategy] Indicator Signal: Period: Daily Yellow+Red Bearish Trend (Drawing charts is a high probability of predicting the market, in order to formulate trading strategies in advance)
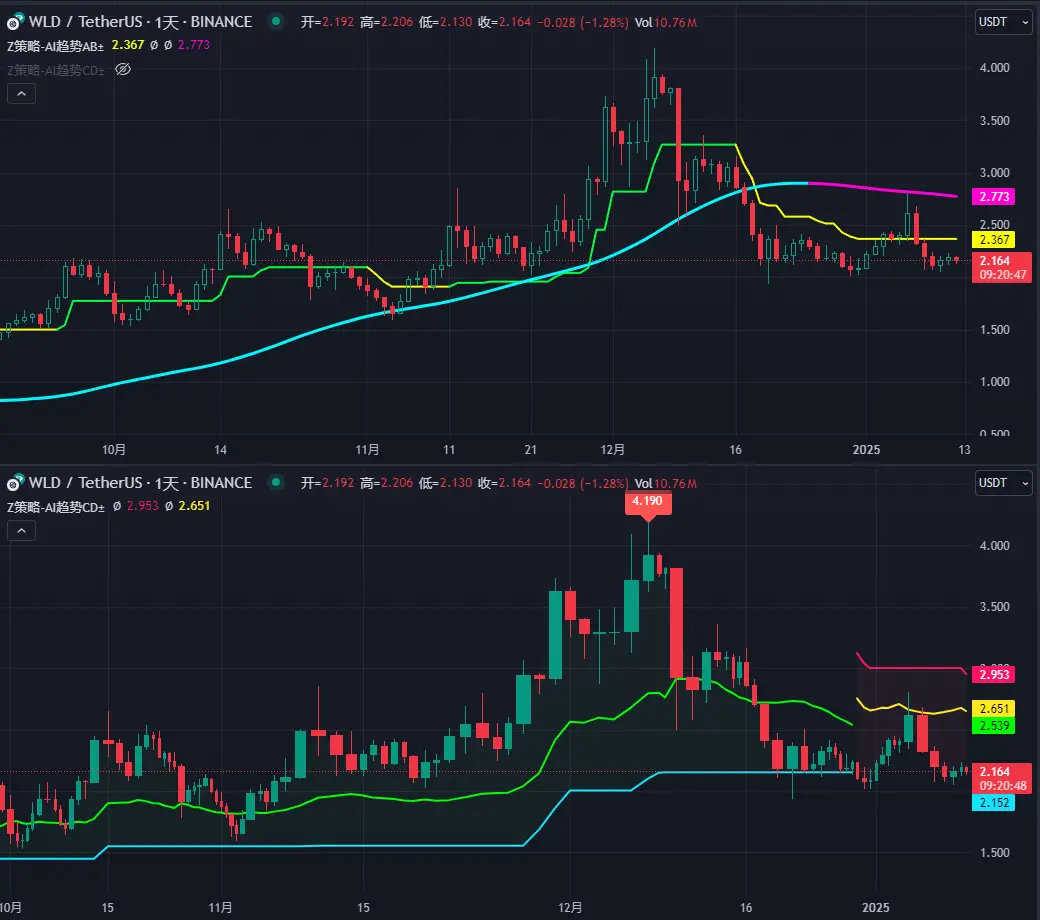
#wld# 【Daily Analysis】AI Sector - WLD 1. The price has reached the important support in the white zone, which is the neckline of the head and shoulders. Hold on and watch for a rebound, continue to fall if broken. 2. Indicator strategy daily signal: red + yellow [bearish]
FET of AIzone 1. FET has currently fallen below the upward channel, and attention should be paid to the important support in the white area below. If it falls below and rebounds, it will continue to explore the bottom. 2. Indicator strategy signal: Daily - red + yellow - bearish
The neckline of the M-top mentioned earlier by AAVE has now been broken and has become a resistance level after a rebound. If it fails to break through and stay above, there is a high probability of further downward movement. Please make your own trading plan.