HUMA/USDT Consolidation Nears End: Can the Price Reclaim $0.04?
HUMA/USDT Latest Price Trend Review

Chart: https://www.gate.com/trade/HUMA_USDT
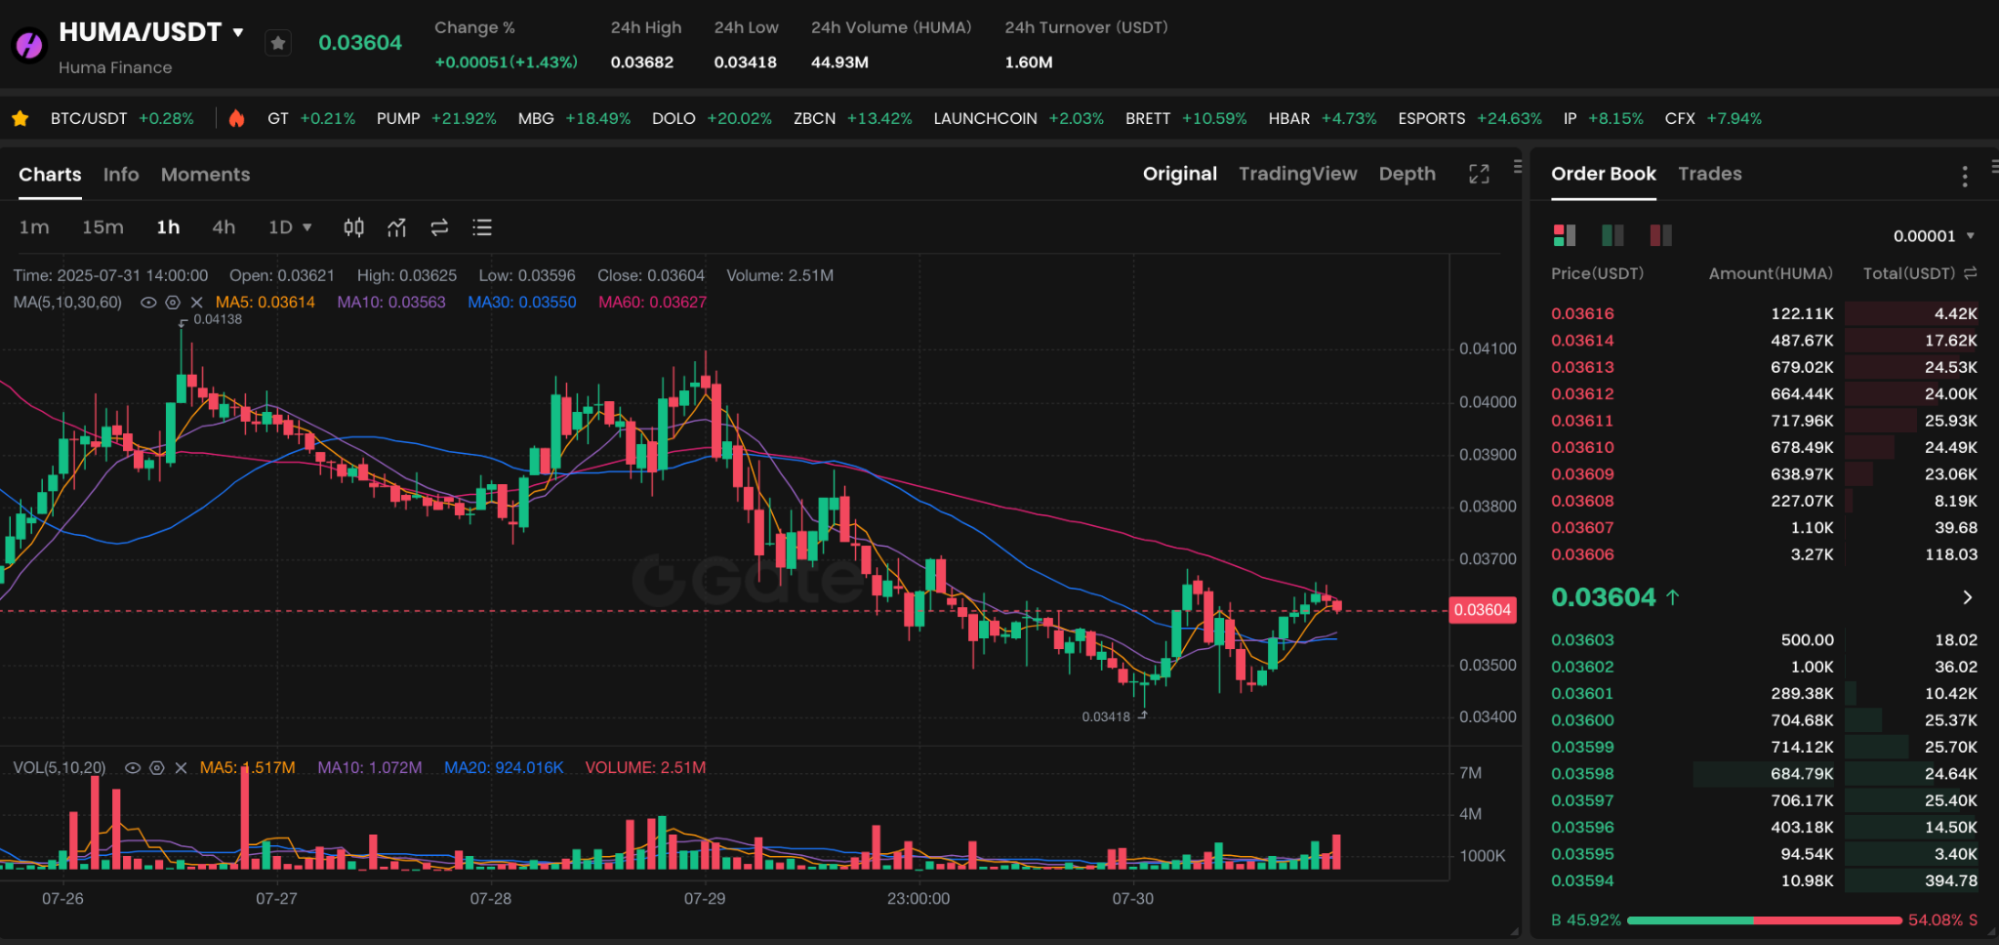
Since July, HUMA/USDT has shown a clear pattern of volatile consolidation. The current price is $0.03241, representing a 4.31% decline from the previous day. On both the daily and 1-hour charts, the trading range has mostly been between $0.03219 and $0.03481. No definitive market trend has emerged so far.
Regarding moving averages, the MA5 and MA30 are currently intertwined, and the price is below the short-term averages, indicating a weak short-term market structure. Both the MACD and RSI indicators also reflect neutral to slightly bearish sentiment, with most investors remaining in a wait-and-see stance.
Contract Data Reveals Shifting Market Sentiment
Gate platform data shows that the current open interest for HUMA perpetual contracts is 12.52 million tokens, with a 24-hour trading volume of approximately $730,000. This suggests that, despite low prices, trading activity remains robust.
Notably, the current funding rate of -0.0089% indicates that short sellers are paying interest to maintain their positions. This could suggest an increase in short-term bearish sentiment. However, given that the negative funding rate is limited, it does not yet provide a basis for predicting a dramatic sentiment reversal.
PayFi Model and Fundamental Progress
As a key PayFi protocol in the Solana ecosystem, the HUMA project is focused on unlocking the liquidity of real-world income streams via on-chain solutions. By integrating with payment systems like Superfluid, Stripe, and Circle, HUMA is able to convert “future income” into collateral, opening new financing channels for freelancers and creators.
Recently, HUMA has not announced any significant positive developments or protocol upgrades, which may explain the current lack of bullish momentum. Nevertheless, its strong real-world application base continues to offer long-term support for the project.
Technical Analysis: Support and Resistance Levels
The key support for HUMA/USDT now stands at $0.0320. If this level is breached, the price may test the previous low around $0.029. On the upside, primary resistance levels are at $0.0348 and $0.036. A breakout above these could restart a rebound rally.
In terms of trading volume, the average daily trading volume is currently around 200,000 tokens, signaling persistent market sluggishness. If bullish volume surges, it could indicate a trend reversal.
Investment Recommendation: Watch for Opportunities to Buy on Dips
For medium- and short-term investors, the current trading range in HUMA/USDT presents relatively clear opportunities to buy on dips. If the price pulls back and holds below $0.032, investors might consider opening a small position. The target range could be $0.035–$0.038.
Long-term investors should continue to monitor ecosystem expansion, progress in integrating off-chain payment systems, and the token release schedule.
Summary
Following its rapid rise in mid-June, HUMA/USDT has entered a consolidation phase with a gradually narrowing trading range. While overall market enthusiasm has waned, both contract data and project fundamentals indicate that HUMA still has upward potential. Exercising patience and waiting for a technical breakout could present new buying opportunities.


