

Power777
No content yet
Power777
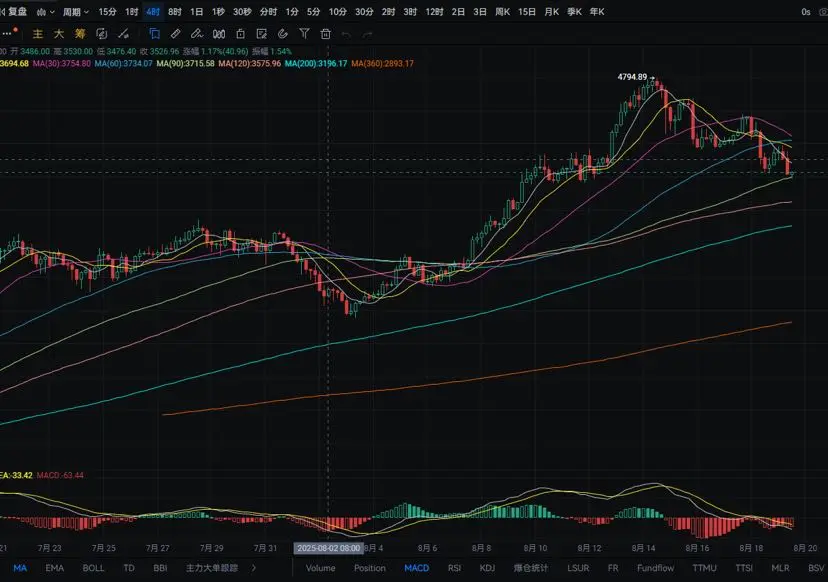
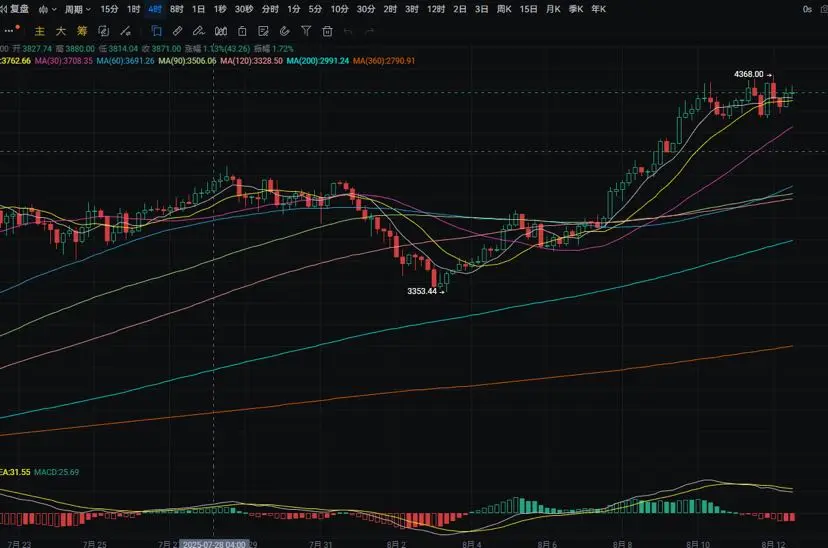
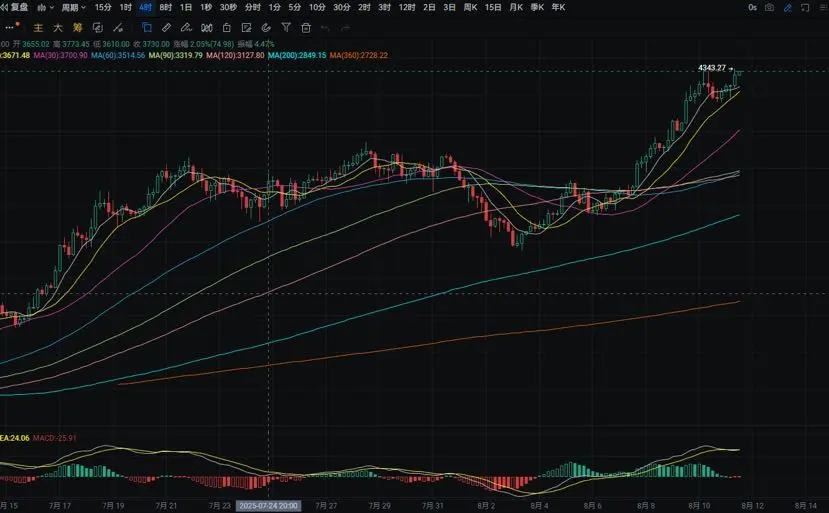
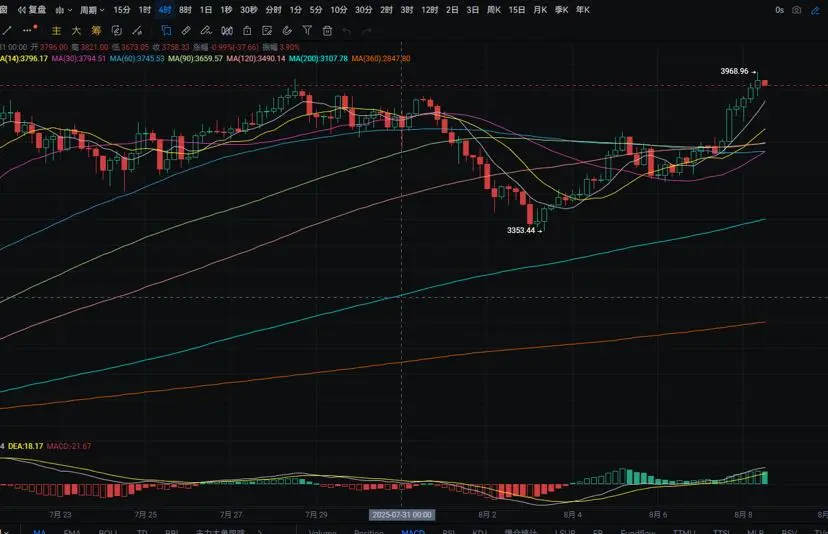
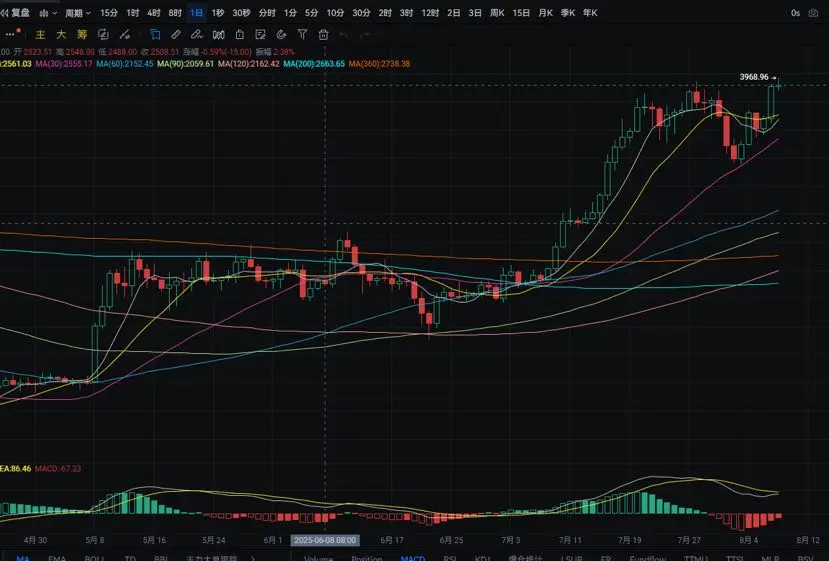
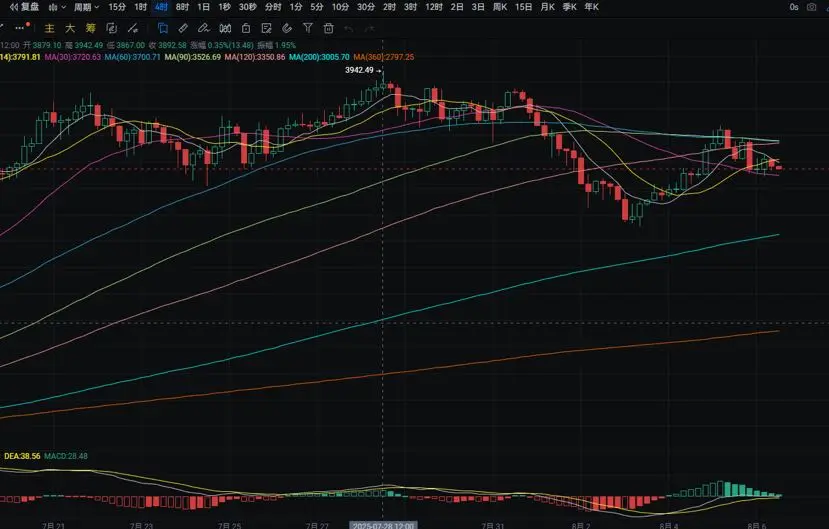
Ether daily chart yesterday fell from a high of around 4480 to a low of around 4220, closing at around 4315. The support level is around 4165; if it breaks, it can be seen at the MA30 for a retest, where long positions can be taken. The resistance level is near the MA7 moving average; if broken, it can be seen around 4585. A rebound to this area can be used for short positions. The MACD shows an increase in short positions, forming a death cross. On the four-hour chart, the support level is near the MA90; if broken, it can be seen around the MA120 for a retest, where long positions can be take
ETH-4.07%
- Reward
- like
- 1
- Repost
- Share
Speaker:
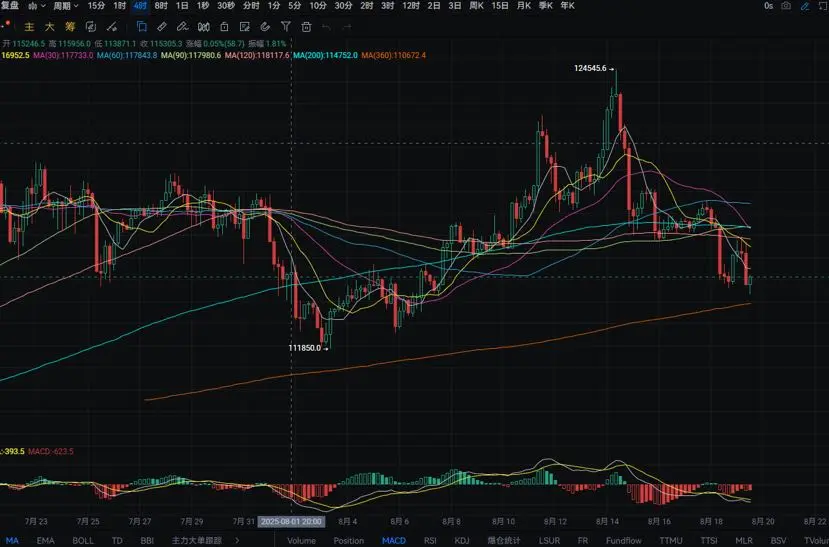
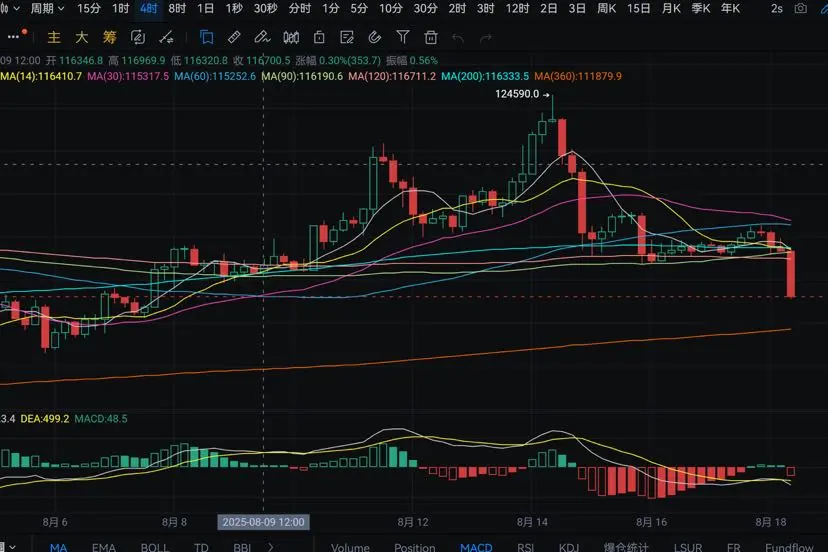
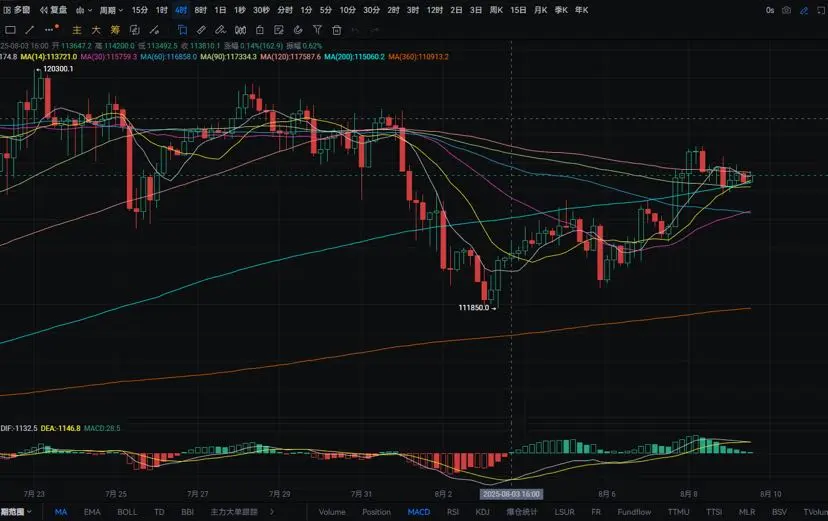
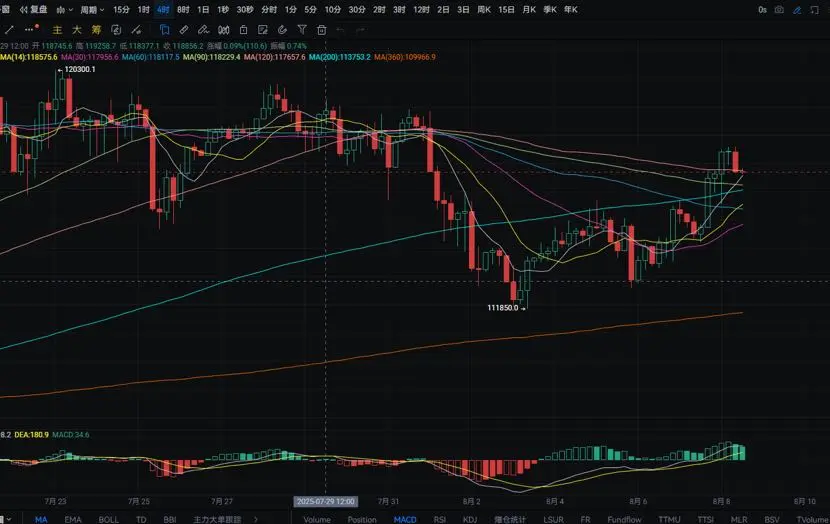
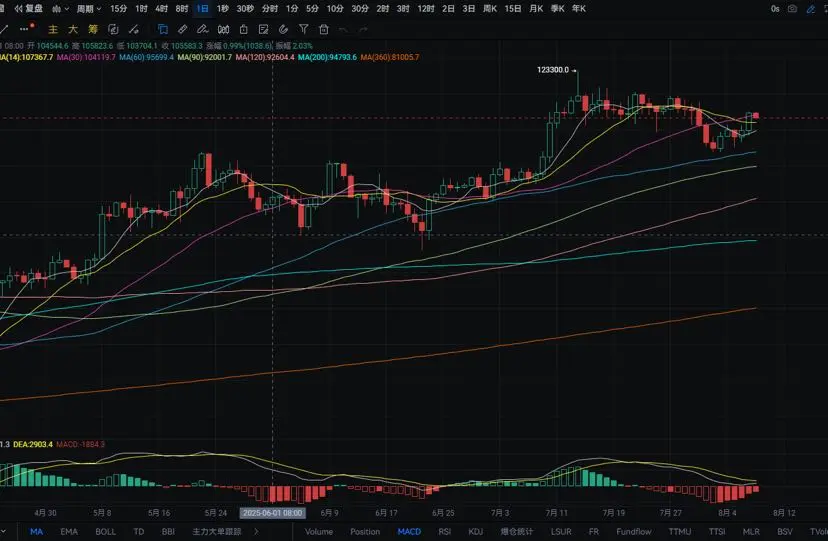
garbageBTC daily chart yesterday fell from a high of around 117500 to a low of around 114600, closing near 116200. The support level is near MA60; if broken, we can look at MA90. If it pulls back, we can consider entering long positions nearby. The resistance level is near MA14; if broken, we can look at around 119950. A rebound to nearby levels can be used to enter short positions. MACD shows an increase in short positions, forming a death cross. On the four-hour chart, the support level is near the MA360 yearly line; if broken, we can look at around 112500. If it pulls back, we can consider enterin
BTC-2.54%
- Reward
- 1
- Comment
- Repost
- Share
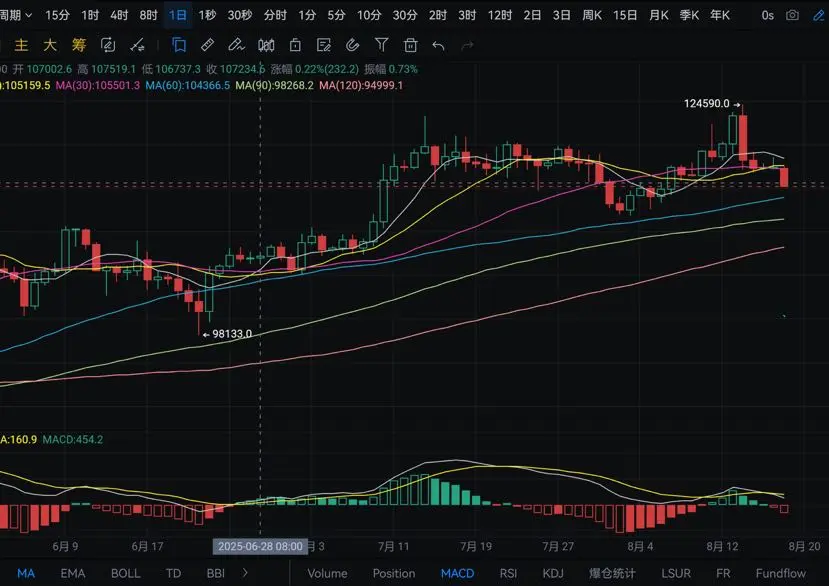
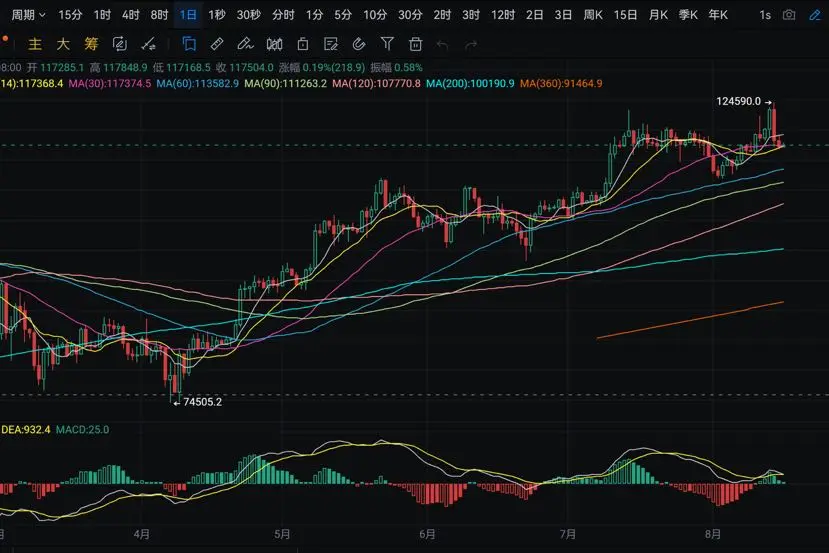
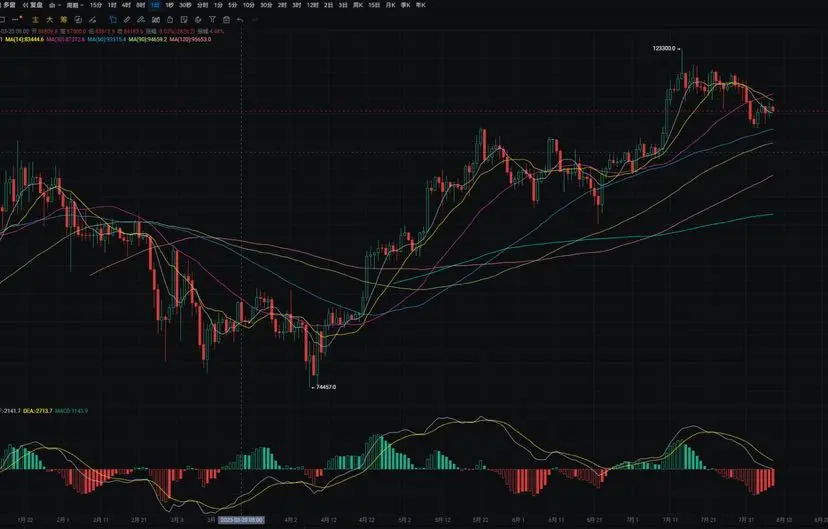
The daily chart of BTC yesterday rose from the lowest point around 117150 to the highest point around 118550, closing near 117350. The support level is near MA60; if it falls below, it could drop to around MA90. A rebound could allow for long positions nearby. The resistance level is around 119200; if broken, it could rise to around 121000. A rebound to this vicinity could allow for short positions. The MACD shows an increase in short positions, forming a death cross. In the four-hour chart, the support level is near 114150; if it falls below, it could drop to around 112850. A rebound could al
BTC-2.54%
- Reward
- like
- Comment
- Repost
- Share
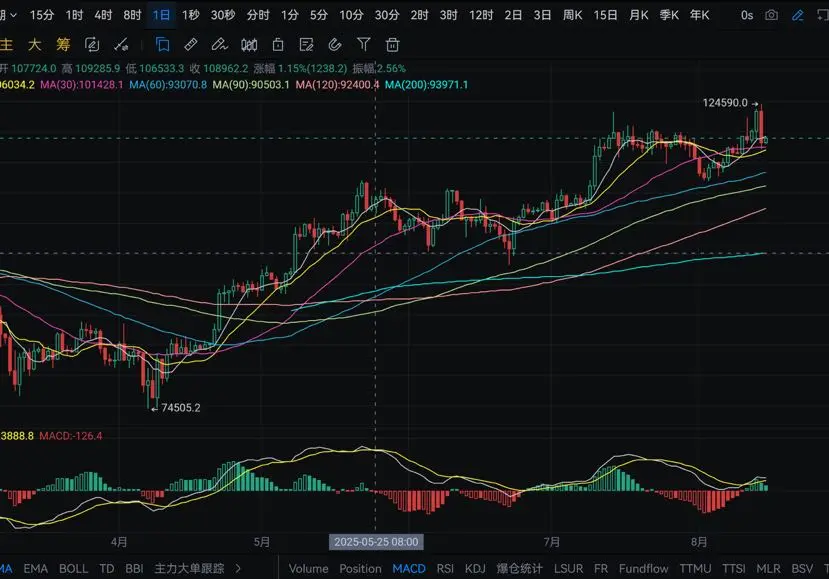
The daily chart of BTC rose from the lowest point near 117100 to the highest point near 117850 yesterday, closing around 117350. The support level is located around 116450; if it breaks, we can look towards MA60. A pullback can be used to enter long positions nearby. The resistance level is around 120100; if it breaks, we can look towards 121550. A rebound to nearby can be used to enter short positions. The MACD shows a decrease in long positions. The support level on the four-hour chart is near MA120; if it breaks, we can look towards 153000. A pullback can be used to enter long positions nea
BTC-2.54%
- Reward
- like
- Comment
- Repost
- Share
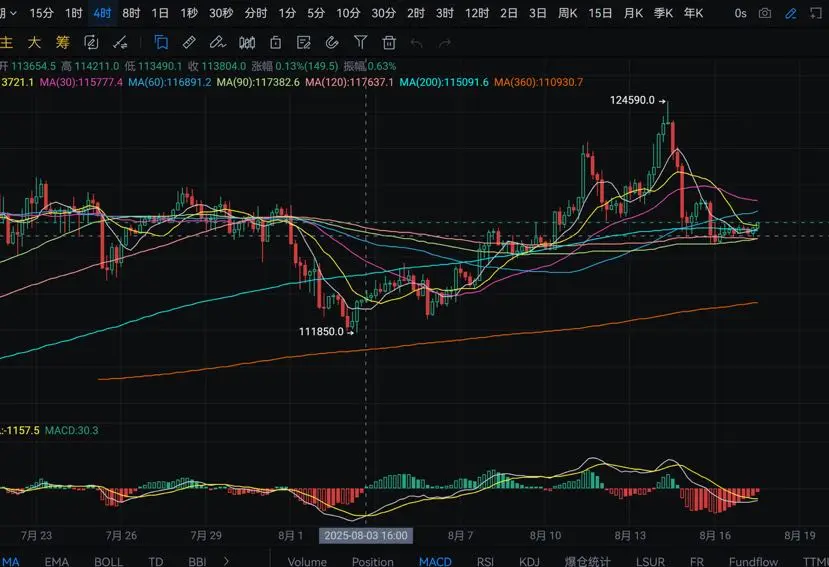
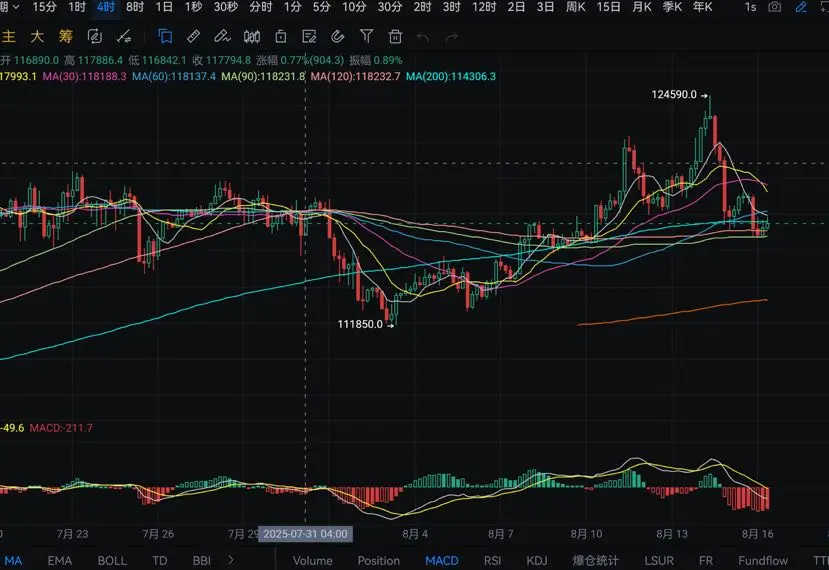
The BTC daily chart yesterday fell from a high of around 119200 to a low of around 116750, closing at around 117300. The support level is located around 116050; if broken, it can drop to near MA60. A pullback can be an opportunity to enter long positions nearby. The resistance level is around 119750; if broken, it can rise to around 121950. A rebound to nearby can be an opportunity to enter short positions. The MACD shows a decrease in long positions and has signs of forming a death cross. On the four-hour chart, the support level is around 116400; if broken, it can drop to around 114600. A pu
BTC-2.54%
- Reward
- like
- Comment
- Repost
- Share
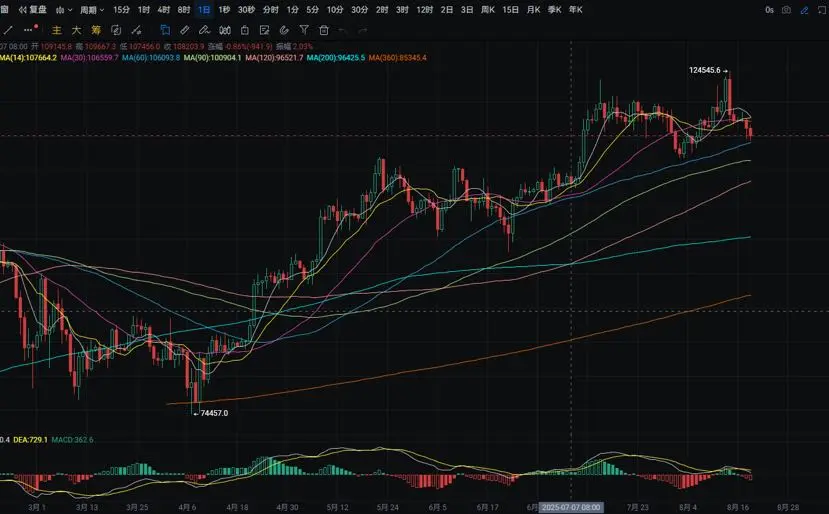
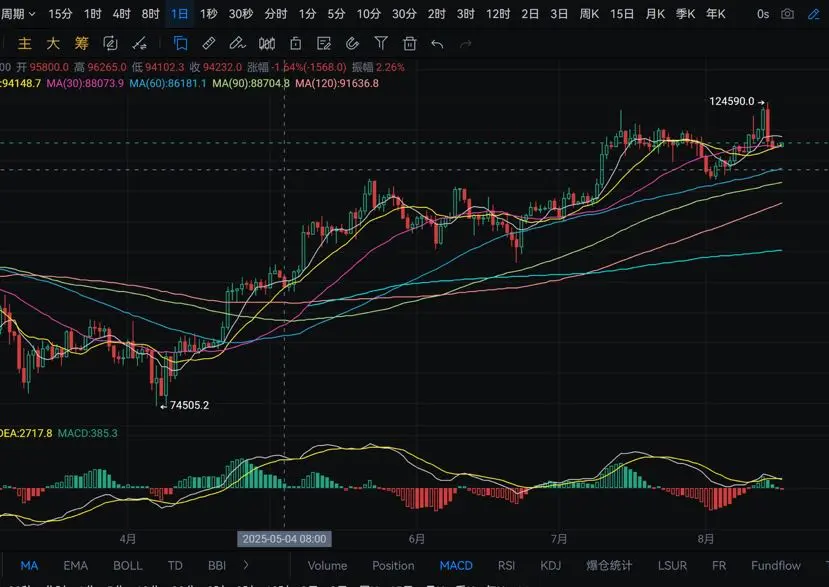
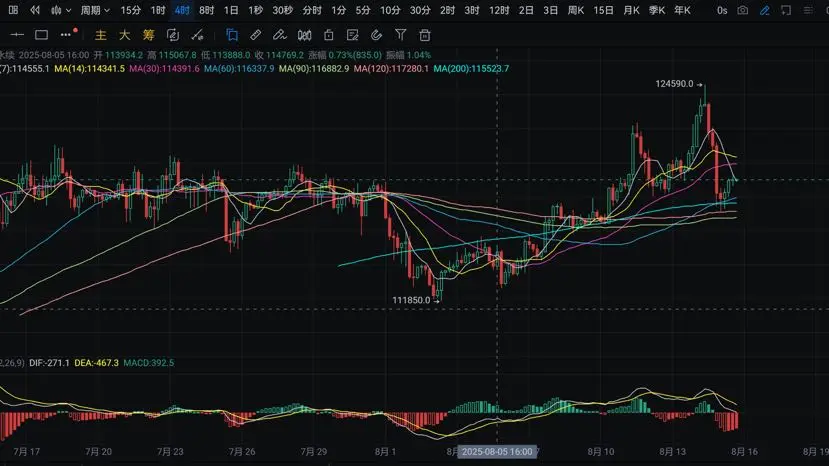
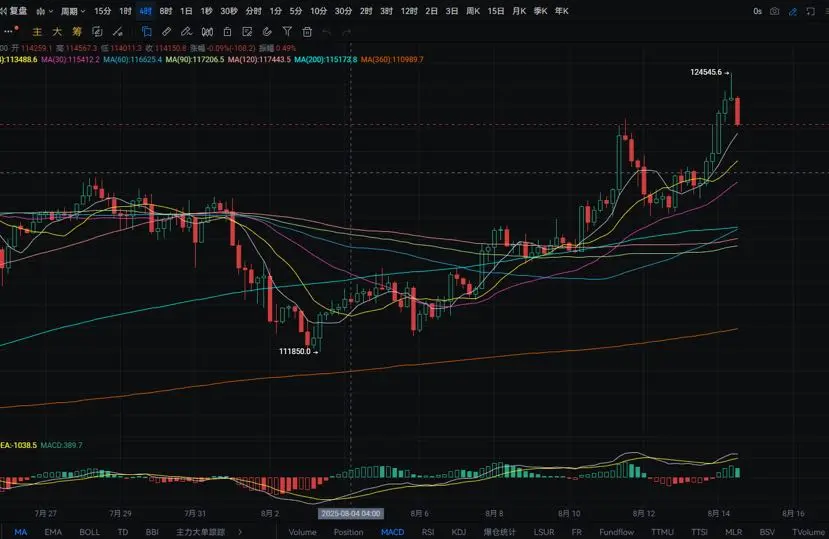
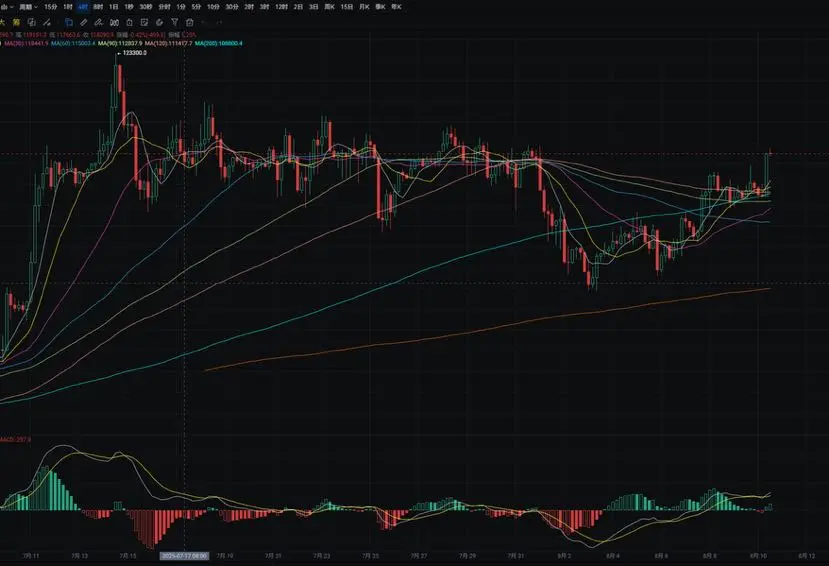
The BTC daily chart yesterday fell from a high of around 124600 to a low of around 117150, closing at around 118250. The support level is around 115000; if it breaks below, it could be seen near MA60. A pullback could be an opportunity to enter long positions nearby. The resistance level is around 120300; if it breaks through, it could be seen at a new high. The MACD shows a decrease in long positions, indicating signs of a death cross. On the four-hour chart, the support level is near MA200; if it breaks below, it could be seen near MA90. A pullback could be an opportunity to enter long posit
BTC-2.54%
- Reward
- like
- Comment
- Repost
- Share
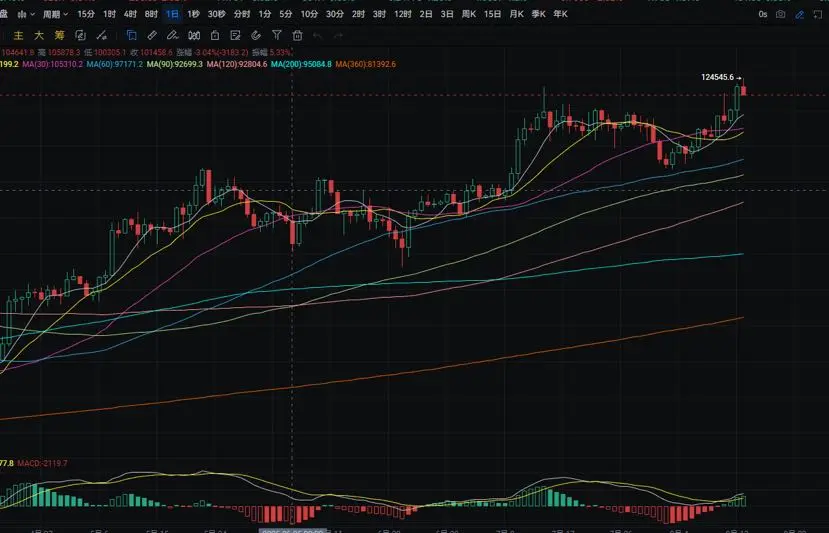
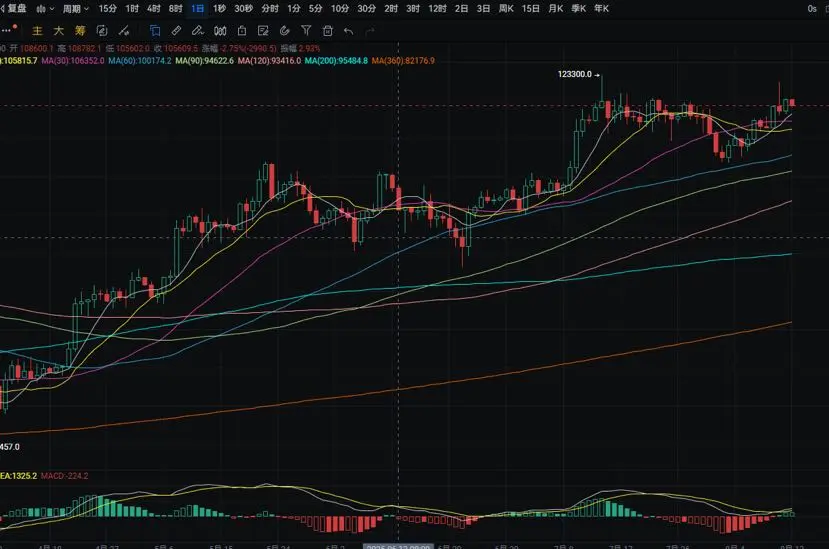
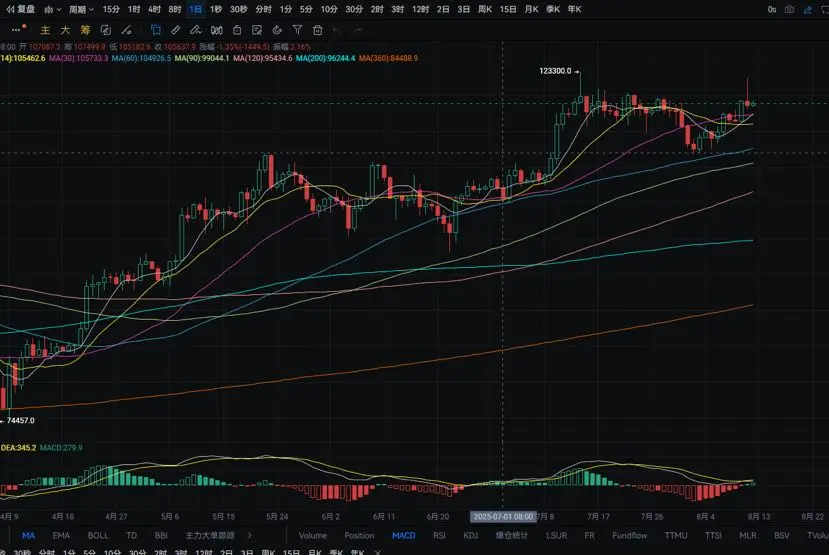
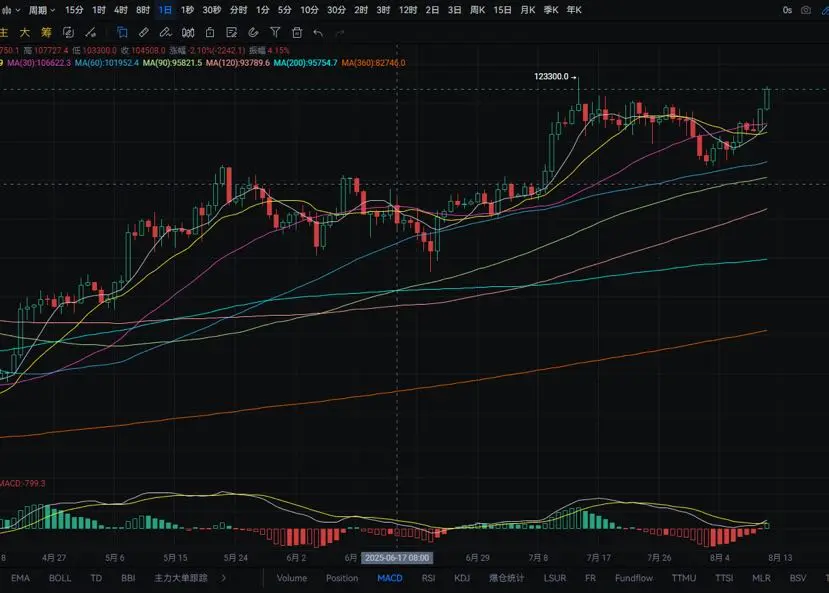
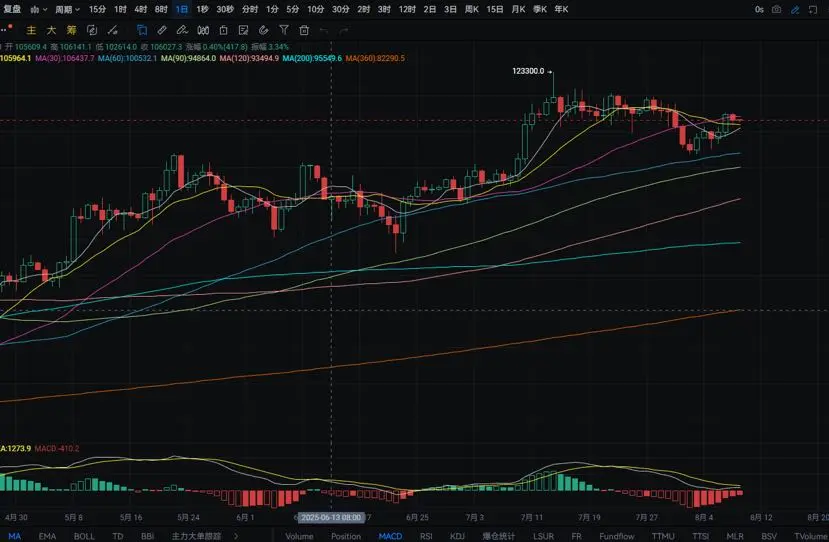
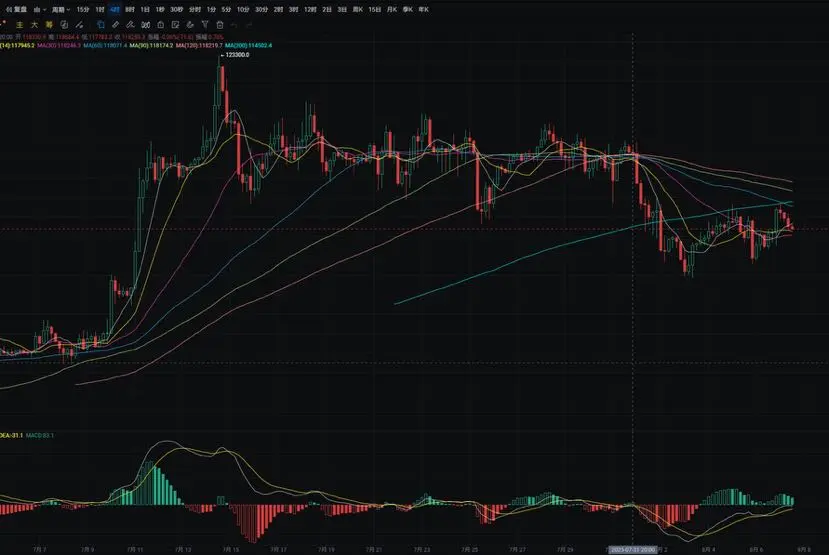
BTC daily chart yesterday rose from around 118850 to a high of around 123700, closing near 123300. The support level is around 120100; if it breaks, we can look towards MA30. A pullback can be used to enter long positions nearby. On the upside, we can look towards new highs. MACD long positions increase. The four-hour chart shows support near the MA7 moving average; if it breaks, we can look towards MA14. A pullback can be used to enter long positions nearby. MACD long positions increase.
BTC-2.54%
- Reward
- like
- Comment
- Repost
- Share
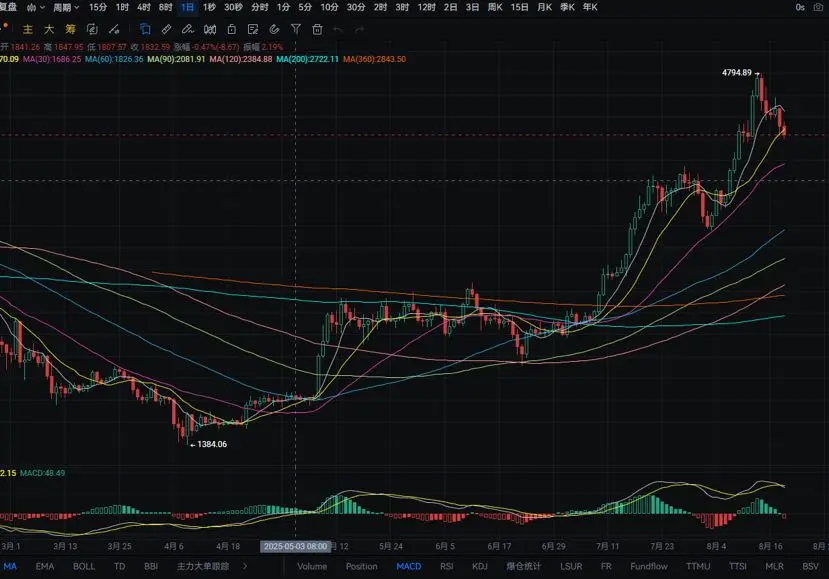
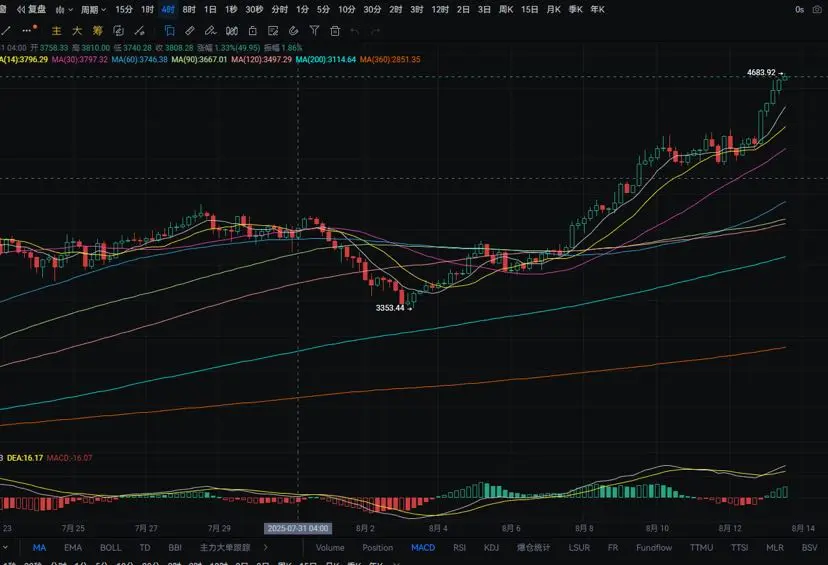
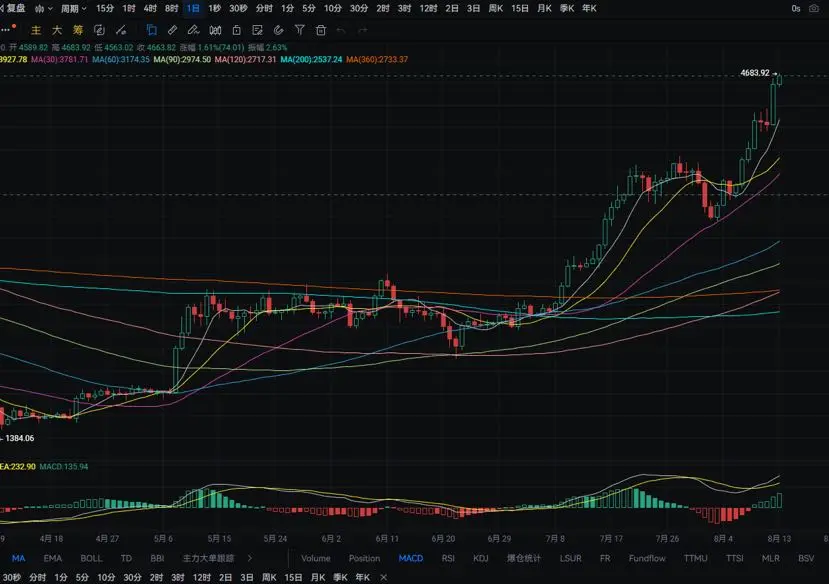
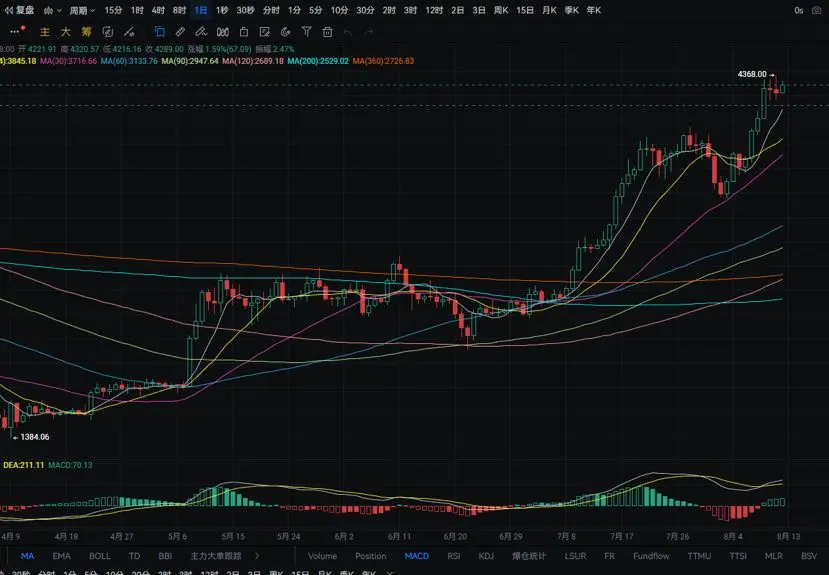
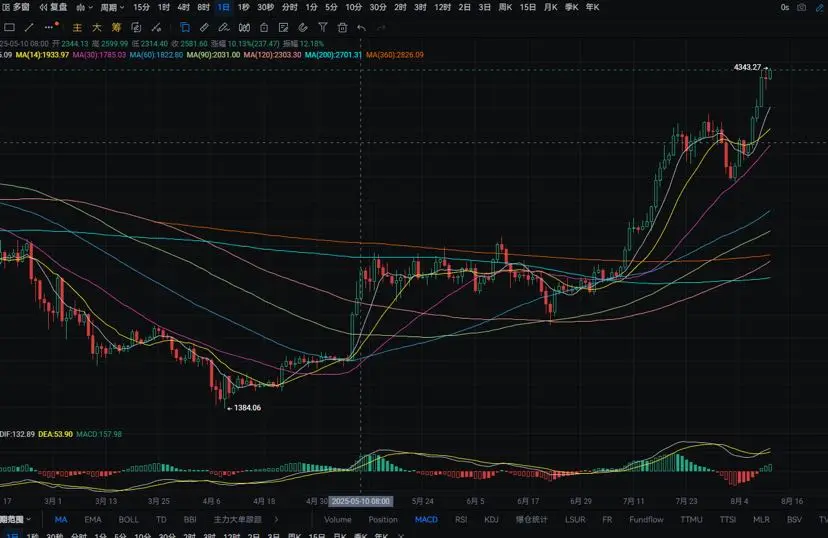
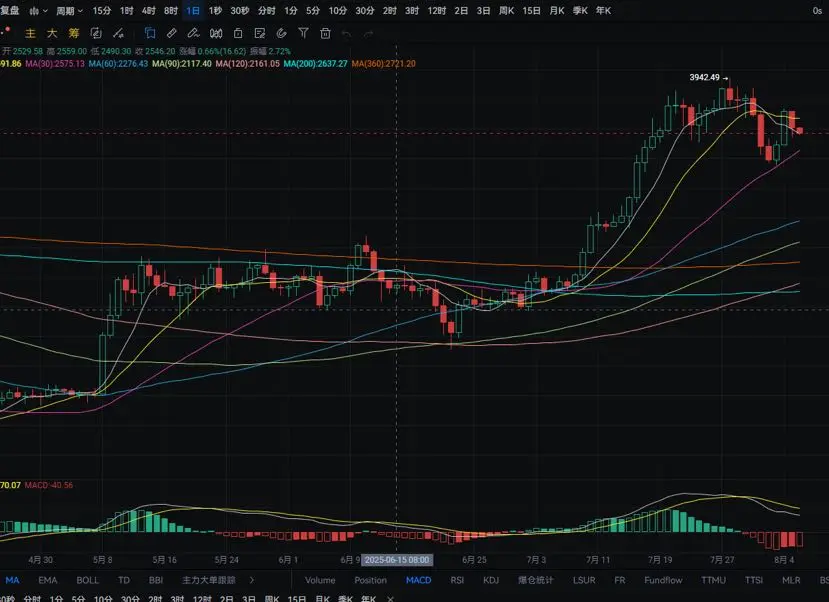
Ether daily chart yesterday pumped from the lowest around 4215 to the highest around 4640, closing near 4589. The support level is around 4330; if it breaks down, it could look to around 4175. A pullback can be used to enter long positions nearby. The resistance level is around 4750; if it breaks through, it could look to new highs. MACD shows an increase in long positions. In the four-hour chart, the support level is around 4470; if it breaks down, it could look to MA30 nearby. A pullback can be used to enter long positions nearby. MACD shows an increase in long positions, forming a golden cr
ETH-4.07%
- Reward
- like
- Comment
- Repost
- Share
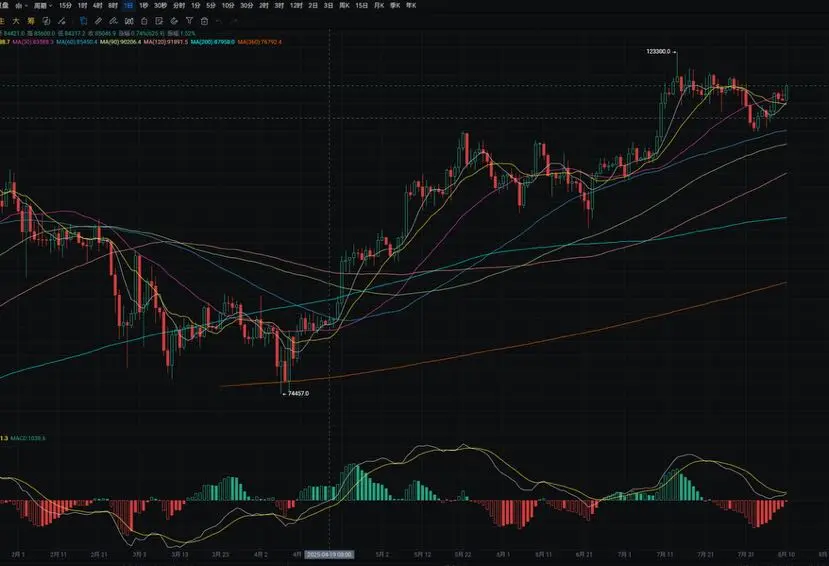
The daily chart of BTC rose from around 118150 yesterday to a high of around 120250, closing near 120100. The support level is located near MA30; if it breaks down, we can look towards around 115000. A pullback can be used to enter long positions in the vicinity. The resistance level is around 121000; if it breaks through, we can look towards the previous high. A rebound in the vicinity can be used to enter short positions. The MACD shows an increase in long positions. On the four-hour chart, the support level is near MA30; if it breaks down, we can look towards MA200. A pullback can be used t
BTC-2.54%
- Reward
- 2
- Comment
- Repost
- Share
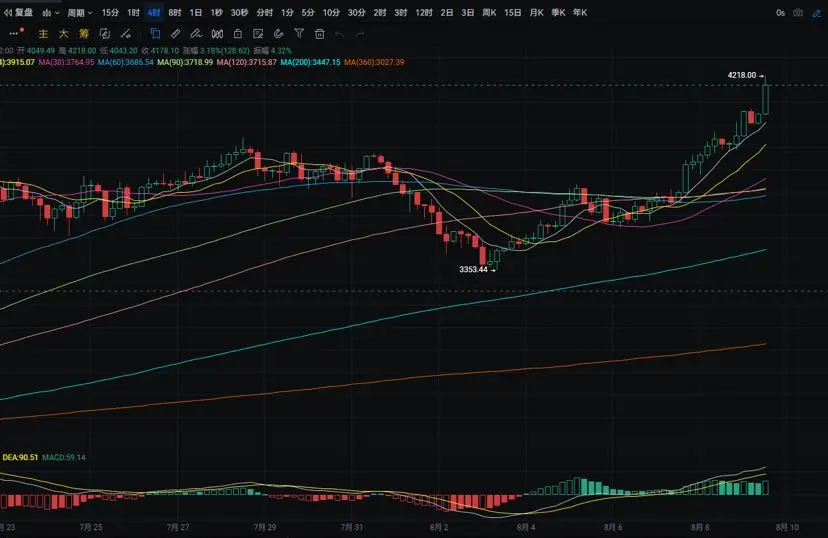
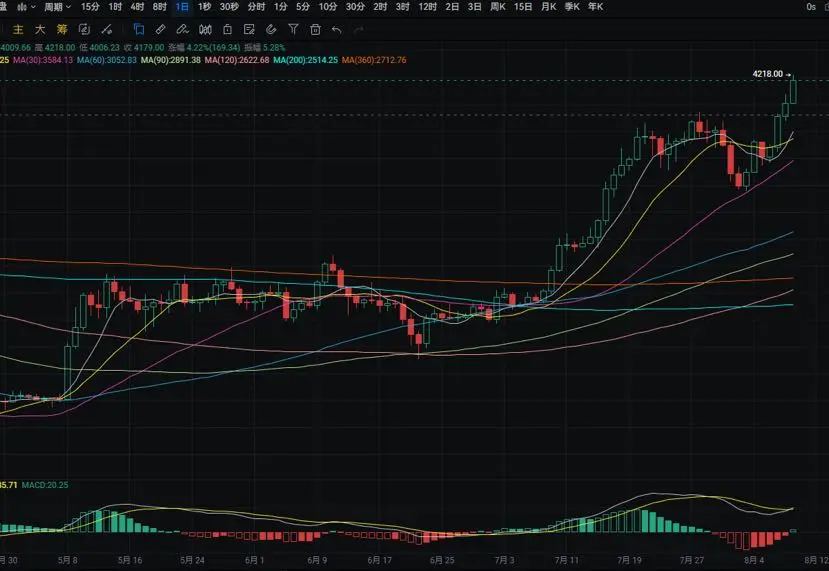
Ether daily chart yesterday fell from a high of around 4370 to a low of around 4165, closing near 4220. The support level is near the MA7 moving average; if it breaks, we can look towards the MA14 area. A pullback can be used for long positions in the vicinity. The resistance level is around 4400. The MACD shows an increase in long positions. On the four-hour chart, the support level is near 4185; if it breaks, we can look towards 4055. A pullback can be used for long positions in the vicinity. The MACD shows a decrease in short positions.
ETH-4.07%
- Reward
- like
- Comment
- Repost
- Share
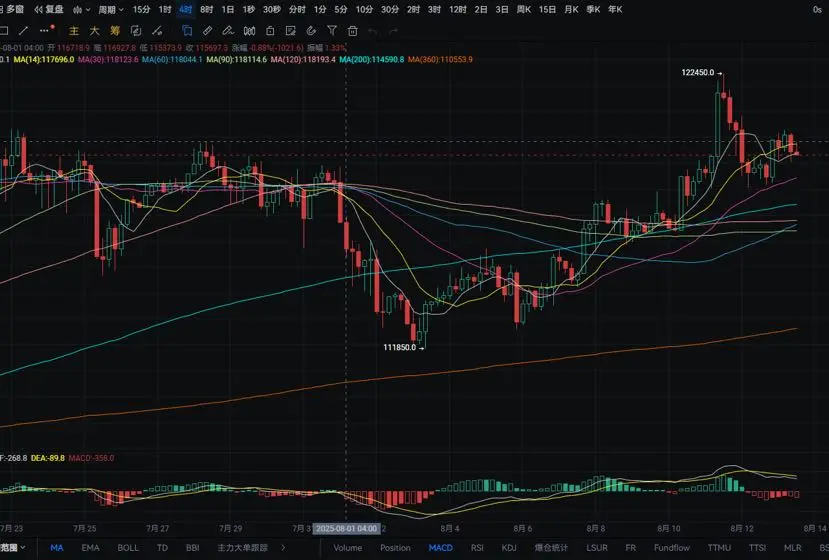
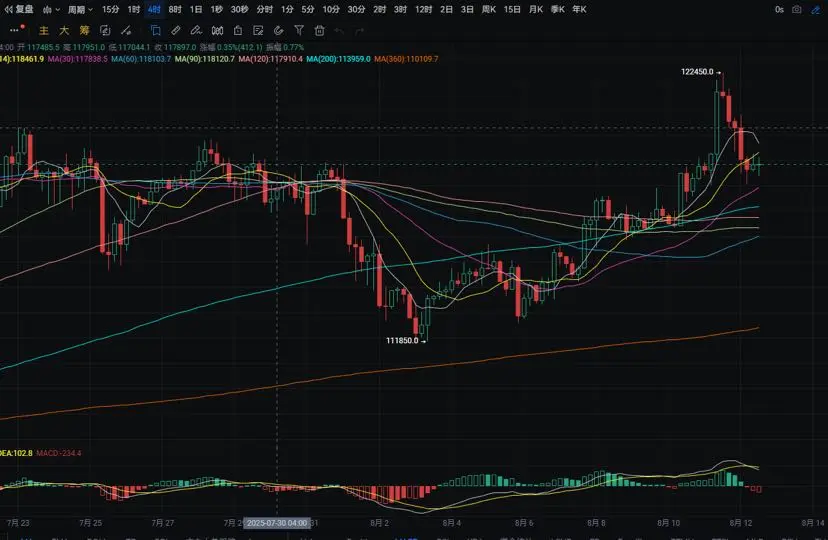
The daily chart of BTC fell from a high of around 122450 yesterday to a low of around 118050, closing at around 118650. The support level is near MA30, and if it breaks, we can look to around 114900. A pullback can be taken at this level for long positions. The resistance level is around 120000; if it breaks, we can look to new highs. The MACD shows an increase in long positions. The four-hour chart shows support near 117500; if it breaks, we can look to around MA200. A pullback can be taken at this level for long positions. The resistance level is around 120300; if it breaks, we can look to a
BTC-2.54%
- Reward
- like
- Comment
- Repost
- Share
Ether daily chart yesterday fell from a high of around 4335 to a low of around 4160, closing near 4250. The support level is around 4110; if it breaks, we could see it drop to around 3905. A pullback may occur near this level for long positions. The resistance level is around 4400. MACD long positions are increasing, forming a golden cross pattern. On the four-hour chart, the support level is near MA14; if it breaks, we could see it drop to around 4060. A pullback may occur near this level for long positions. MACD is oscillating and flattening, with the two lines converging.
ETH-4.07%
- Reward
- like
- Comment
- Repost
- Share
On the daily chart for BTC, it rose from a low of around 116400 yesterday to a high of around 119300, closing at around 119250. Currently, it has reached around 121800, with a support level at around 120200. If it falls below this, it could go down to around 118200. A pullback could allow for long positions in the vicinity. To the upside, we can look for new highs. MACD shows an increase in long positions, forming a golden cross pattern. On the four-hour chart, the support level is around 120000. If it breaks below this, it could drop to around 118300. A pullback could allow for long positions
View Original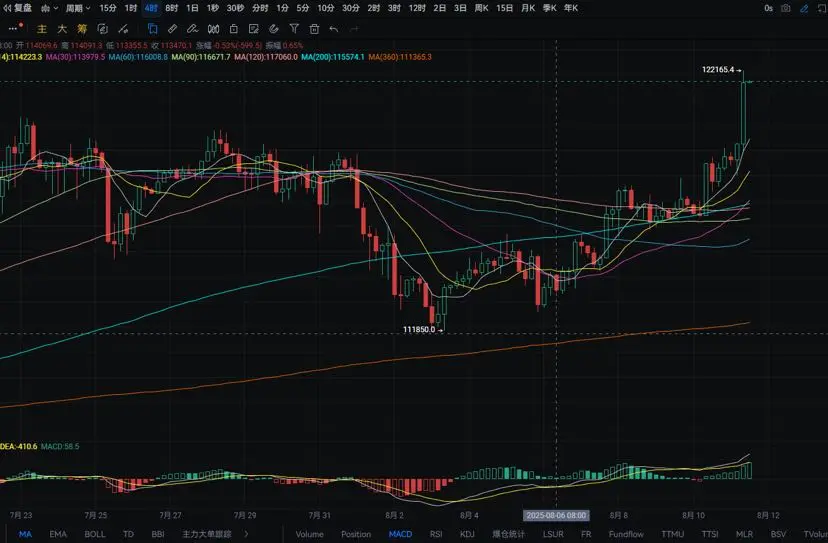
- Reward
- like
- Comment
- Repost
- Share
The daily chart of BTC fell from the highest near 117900 yesterday to the lowest near 116300, closing around 116400. The support level is near MA14; if it breaks down, we can look to MA60. A pullback can be used to enter long positions near this level. The resistance level is near 119100; if it breaks through, we can look to 121000. A rebound to this area can be used to enter short positions. MACD shows a decrease in short positions with signs of a golden cross pattern. In the four-hour chart, the support level is near MA14; if it breaks down, we can look to MA30. A pullback can be used to ent
BTC-2.54%
- Reward
- like
- Comment
- Repost
- Share
The Ether daily chart rose from a low of around 3875 to a high of around 4075 yesterday, closing near 4010. The support level is around 4000; if it breaks below, it could drop to around 3875. A pullback could provide an opportunity to enter long positions nearby. The MACD shows a decrease in short positions, with signs of a golden cross pattern forming. On the four-hour chart, support is around 4055; if it breaks below, it could drop to near the MA14. A pullback could provide an opportunity to enter long positions nearby. The MACD shows an increase in long positions.
ETH-4.07%
- Reward
- like
- Comment
- Repost
- Share
BTC daily chart yesterday fell from a high of around 117600 to a low of around 115850, closing around 116650. The support level is around 115000; if it breaks, we could see around 113350. A pullback could be an opportunity to enter long positions nearby. The resistance level is around 118650; if it breaks, we could see around 119800. A rebound to nearby levels could be an opportunity to enter short positions. MACD shows a decrease in short positions. In the four-hour chart, the support level is around 115700; if it breaks, we could see around 114750. A pullback could be an opportunity to enter
BTC-2.54%
- Reward
- like
- Comment
- Repost
- Share
Ether daily chart yesterday rose from a low of around 3645 to a high of around 3925, closing near 3910. The support level below is around 3755; if it breaks, it can be seen near MA30. A pullback can be used to enter long positions nearby. The resistance level above is around 4000. MACD shows a decrease in short positions and has signs of forming a golden cross pattern. The support level on the four-hour chart is around 3820; if it breaks, it can be seen near MA120. A pullback can be used to enter long positions nearby. MACD shows an increase in long positions.
ETH-4.07%
- Reward
- like
- Comment
- Repost
- Share
The daily chart of BTC rose from the lowest point near 114200 to the highest point near 117600 yesterday, closing around 117400. The support level is near the MA7 moving average; if it falls below, we can look to the MA60 nearby. If it retraces, we can consider entering long positions nearby. The resistance level is near 118000; if it breaks through, we can look to around 120000. If it rebounds to nearby, we can consider entering short positions. The MACD shows a decrease in short positions. In the four-hour chart, the support level is near the MA200; if it falls below, we can look to the MA30
BTC-2.54%
- Reward
- like
- Comment
- Repost
- Share
The BTC daily chart yesterday rose from a low of around 113300 to a high of around 114650, closing at around 114950. The support level is around 113250; if it falls below, we can look to see it hit around the MA60. A pullback can be used to enter long positions nearby. The resistance level is around the MA14; if it breaks through, we can look to see it hit around the MA30. A rebound to nearby can be used to enter short positions. The MACD shows a decrease in short positions. On the four-hour chart, the support level is around 113550; if it breaks, we can look to see it hit around 112100. A pul
BTC-2.54%
- Reward
- like
- Comment
- Repost
- Share
The Ether daily chart yesterday fell from a high of around 3720 to a low of around 3545, closing at around 3610. The support level is near MA30; if it breaks, we can look towards around 3375. Buying can be done on pullbacks nearby. The resistance level is around 3710; if it breaks, we can look towards around 3805. A rebound to nearby can be used to short. The MACD shows an increase in short positions. On the four-hour chart, the support level is near MA30; if it breaks, we can look towards around 3480. Buying can be done on pullbacks nearby. The resistance level is near MA120; if it breaks, we
ETH-4.07%
- Reward
- like
- Comment
- Repost
- Share