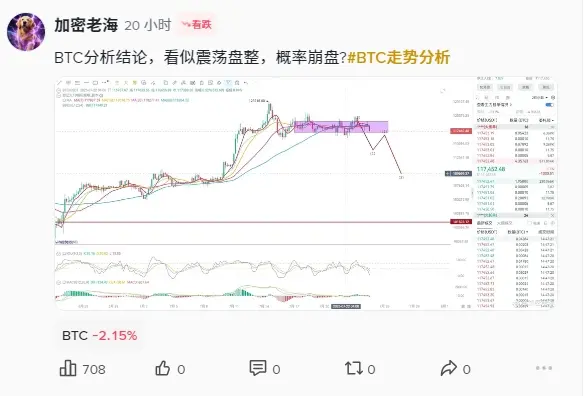
EncryptionOldSea
Ride with the trend, accompany with profit.
- Reward
- like
- 2
- Share
EncryptionOldSea :
:
TBC trash diskView More
- Reward
- 9
- 6
- Share
GetPreparedToPotentialLongWick :
:
Hurry up and enter a position! 🚗View More
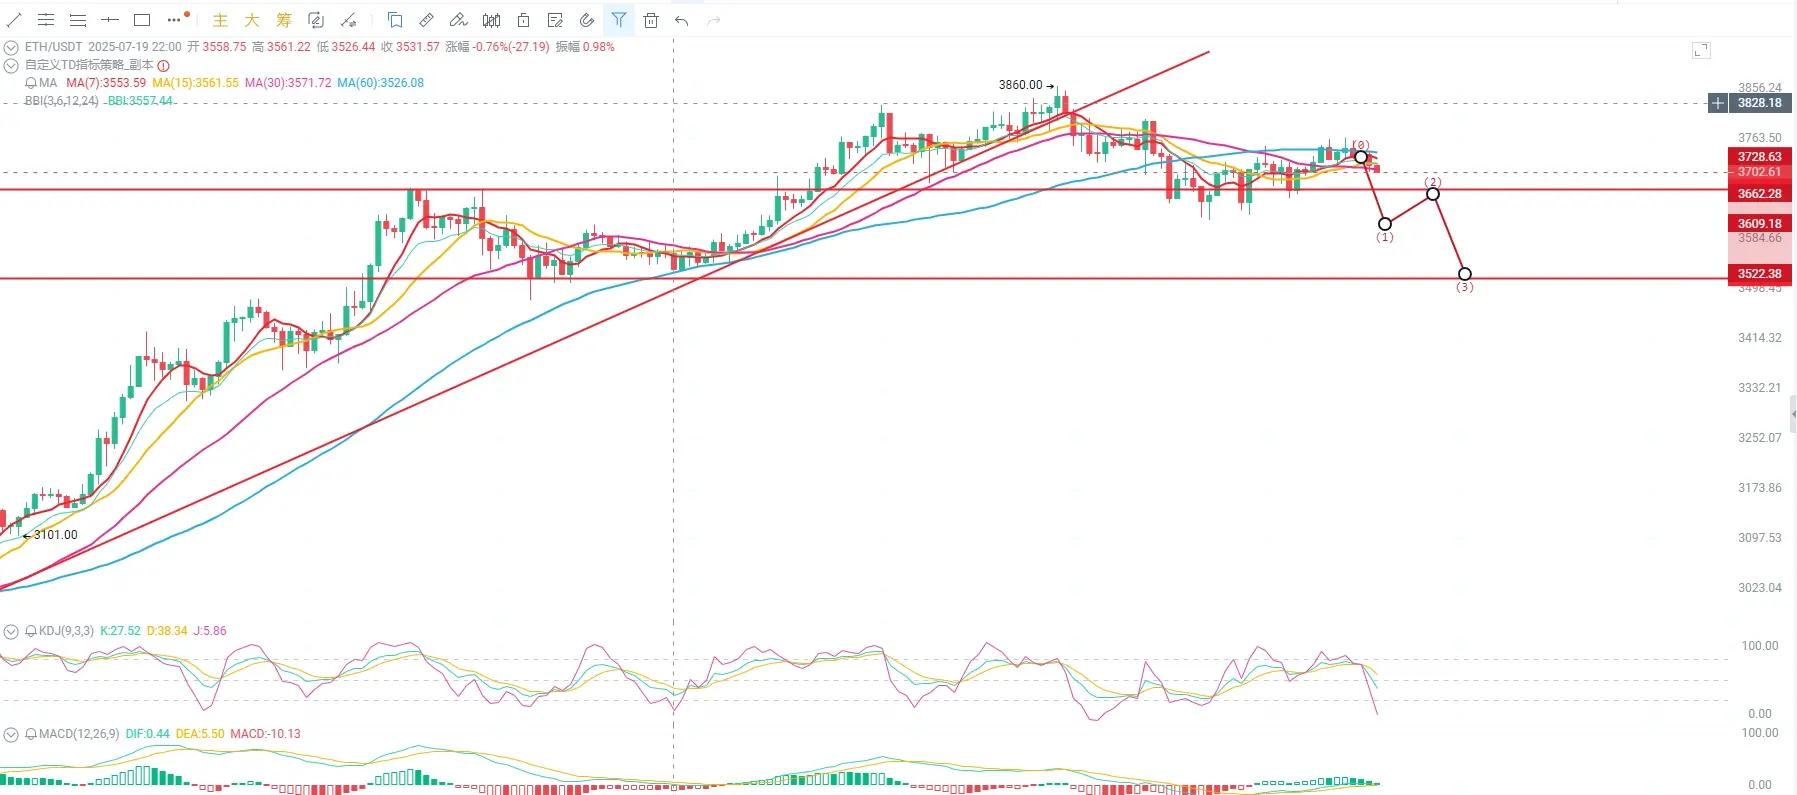
ETH hourly swing trading pullback
Price Trend Analysis
K-line pattern:
The 1-hour chart shows the price oscillating in the range of 3700-3760, with recent multiple tests of the resistance near 3750 followed by a pullback, forming a short-term double top pattern.
The daily chart has shown three consecutive days of long upper shadows, indicating significant selling pressure above 3750, but the lows are gradually rising (3616→3702), forming an ascending wedge.
Technical Indicators:
MACD: 1-hour DIF crossed below DEA (0.93→-0.68), histogram volume decreased, daily MACD high-level death cross (314.
ETH1.73%
- Reward
- 2
- Comment
- Share
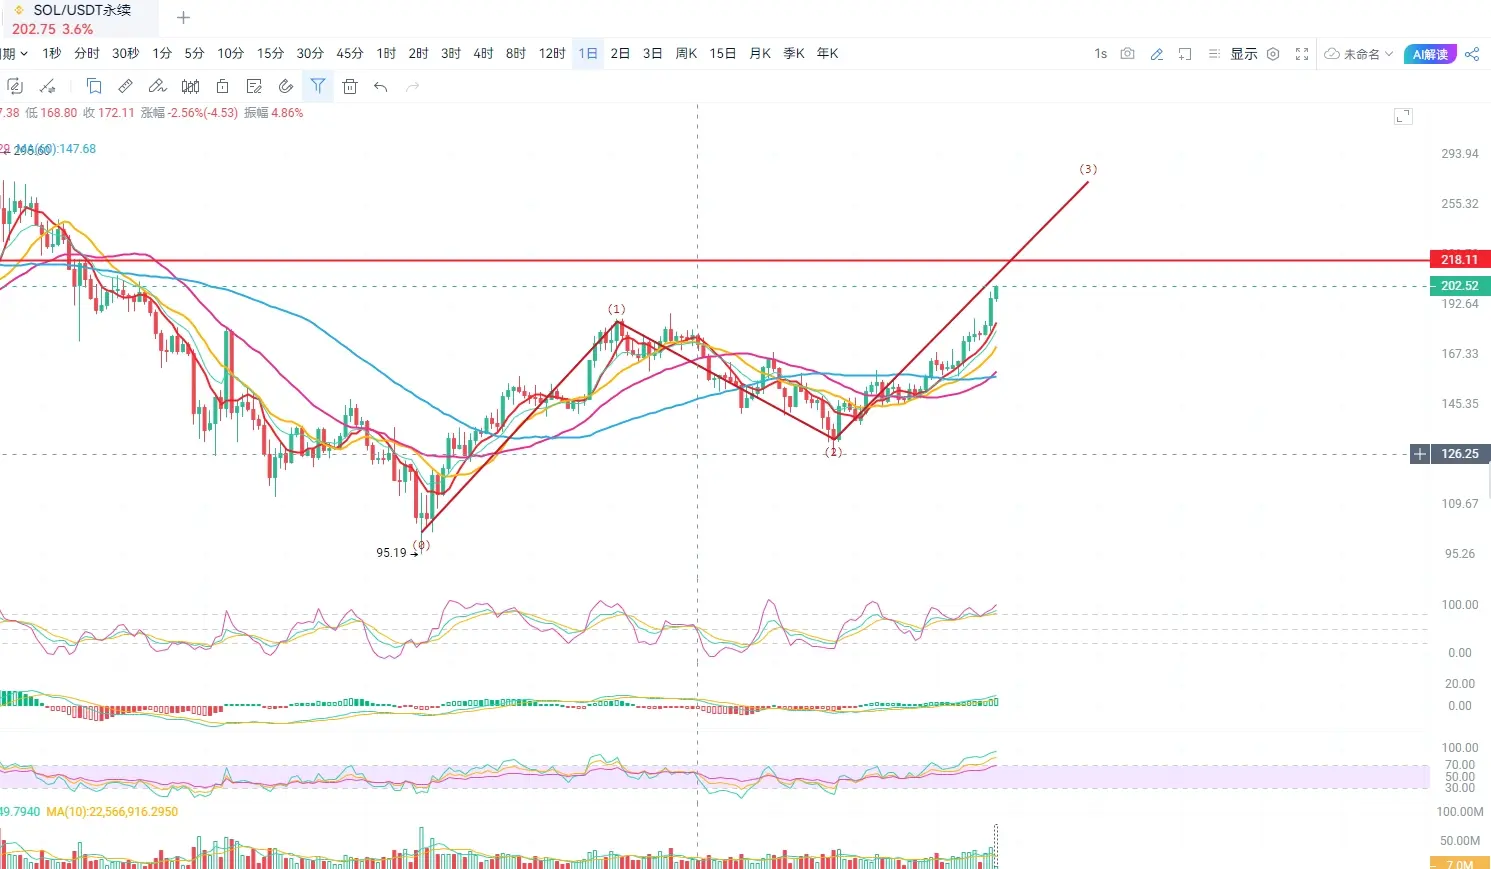
#sol# SOLTo da moon??
K-line pattern:
Recently, there has been a continuous series of bullish candles on the 1-hour chart breaking through the 200 psychological level, with a strong bullish candle at 09:00 (up 4.43%) confirming short-term strength.
The daily chart has formed a three consecutive bullish acceleration structure. After breaking the previous high of 199.28 on the 21st, it reached a new high of 203.02, indicating a typical upward channel.
Technical Indicators:
MACD: 1 hour level DIF ( 3.86) crosses above DEA ( 3.47) forming a golden cross, daily MACD histogram ( 7.87) continues to ex
SOL-3.02%
- Reward
- 5
- 3
- Share
AQuarterPastTwo :
:
Quick, enter a position! 🚗View More

- Reward
- 2
- 1
- Share
GateUser-d2623868 :
:
Ape In 🚀- Reward
- like
- 1
- Share
GT distance prediction is $20, just a tiny bit away! #GateioInto11# #ContentStar#
GT0.68%

- Reward
- 14
- 8
- Share
GateUser-cd55647b:
To Da Moon 🌕View More
btc101200resistance level, blocked near 10500 during the period, forming a high-level range consolidation, oscillating range 100500-101200, 15m level market trend line showing pump trend, probability of pullback in the evening, expected near 98000, if the market breaks through 101200, the market trend will continue upward. #BTC# #GateioInto11# #ContentStar#
BTC-2.24%

- Reward
- like
- Comment
- Share
Chaotic and disordered, building a central trend of rise, is this going to be a big rise? The pattern is really big #BTC# #GateioInto11# #ContentStar#
BTC-2.24%

- Reward
- like
- Comment
- Share
This needle is higher than the Eiffel Tower, I don't know how many people are trapped  #GateioInto11# #ContentStar#
View Original #GateioInto11# #ContentStar# 
- Reward
- like
- 1
- Share
CenturyPioneer:
The 98000 long-short boundary, unable to go short, going long, going up and falling below 98000 short #GateioInto11# #ContentStar#
View Original
- Reward
- like
- Comment
- Share
move8 simultaneously goes live on 5 top exchanges, with a total supply of 10 billion, and a financing of 40 million US dollars. It belongs to the BTC ecosystem and is worth looking forward to #GateioInto11# #ContentStar#
View Original
- Reward
- 1
- 1
- Share
Vasy:
Buy the Dip 🤑
- Reward
- 3
- 2
- Share
EncryptionOldSea:
NextView More
Not sure what to buy in Spot? Then stop and take a look at ordi, last year's inscription leader, with a trading volume of 1 billion. Let's go and charge #BTC# #GateioInto11# #ContentStar# .
View Original
- Reward
- like
- 1
- Share
BrilliantVictory:
Deaf-muteLive streaming recommends morpho1.4 entry to everyone, current 1.8 is about to To The Moon🛫 #GateioInto11# #ContentStar#
MORPHO2.53%

- Reward
- 5
- 2
- Share
GateUser-914ec7f9:
How much did you get, bro?View More
